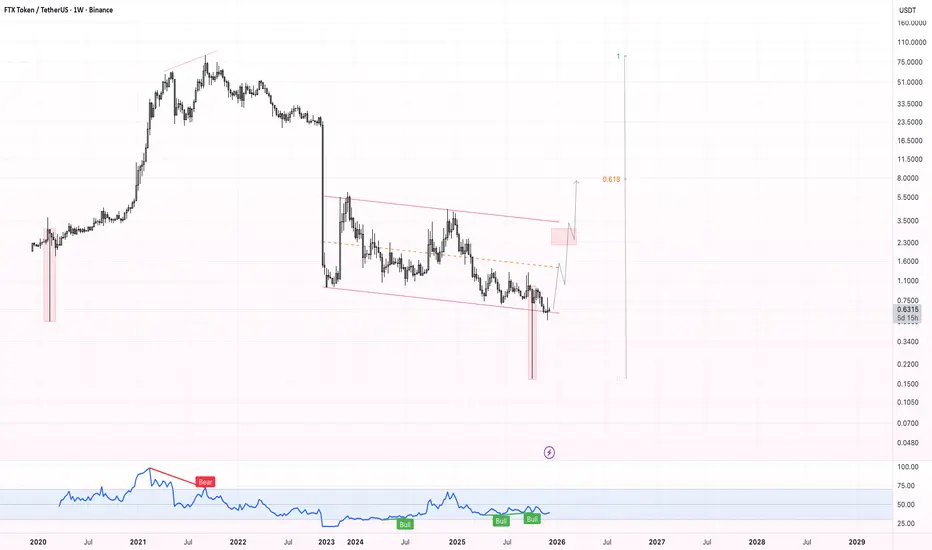
The chart shows a clear bullish divergence forming on the weekly timeframe, which aligns with the structure seen during the major 2020 shakeout. Once again, the price was pushed below the long-term descending channel, triggering an aggressive stop-hunt before quickly reclaiming the range — a classic deviation pattern.
If the asset still hasn’t been delisted despite everything that happened, it suggests that there may be underlying reasons for keeping the token alive. Markets often move ahead of headlines, so a sudden fundamental catalyst shouldn’t be ruled out. Some traders even speculate about potential legal or regulatory news related to the former FTX leadership, which could shock the market if it appears unexpectedly. Whether this materializes or not, the technical structure alone remains notable.
From a TA perspective:
This setup remains speculative and highly volatile, but the technical picture suggests a potential medium-term relief rally if the market continues to absorb sell pressure.
If the asset still hasn’t been delisted despite everything that happened, it suggests that there may be underlying reasons for keeping the token alive. Markets often move ahead of headlines, so a sudden fundamental catalyst shouldn’t be ruled out. Some traders even speculate about potential legal or regulatory news related to the former FTX leadership, which could shock the market if it appears unexpectedly. Whether this materializes or not, the technical structure alone remains notable.
From a TA perspective:
- Price has printed a bullish divergence on the weekly RSI.
- A long-term falling channel remains intact, with price bouncing off its lower boundary.
- A shakeout similar to 2020 may have cleared late sellers and leveraged shorts.
- If momentum continues, the first target zone sits around $2–3, aligning with local resistance.
- The main structural target is a retest of the 0.618 Fibonacci retracement of the major decline from $8 — a level that often acts as a magnet in recovery phases.
This setup remains speculative and highly volatile, but the technical picture suggests a potential medium-term relief rally if the market continues to absorb sell pressure.
Disclaimer
The information and publications are not meant to be, and do not constitute, financial, investment, trading, or other types of advice or recommendations supplied or endorsed by TradingView. Read more in the Terms of Use.
Disclaimer
The information and publications are not meant to be, and do not constitute, financial, investment, trading, or other types of advice or recommendations supplied or endorsed by TradingView. Read more in the Terms of Use.