# 📊 GER40 (DAX INDEX) TECHNICAL ANALYSIS 🎯
## Week of November 10-14, 2025 | Intraday & Swing Trade Mastery
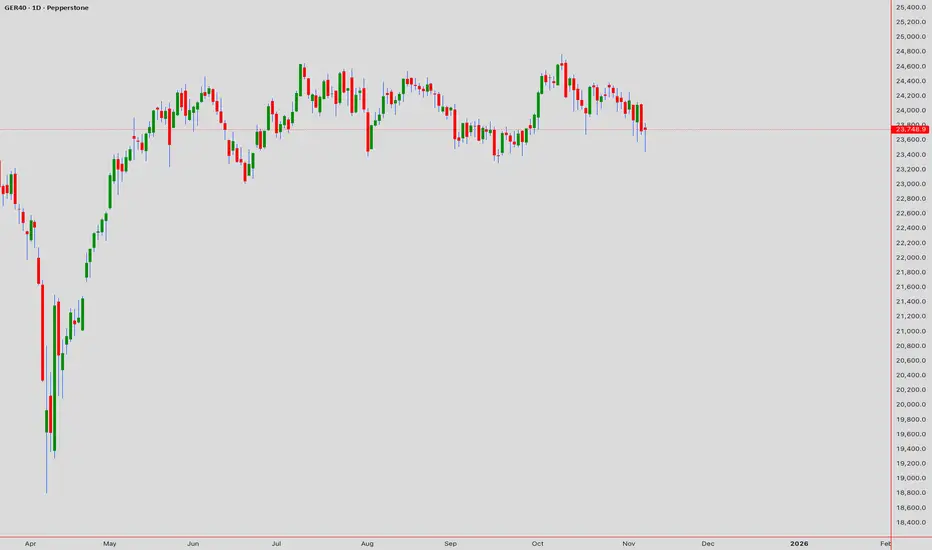
Close Price: 23,748.9 Points | Entry Point: November 8, 2025, 12:54 AM UTC+4 📈
## 🔍 EXECUTIVE SUMMARY - MULTI-TIMEFRAME PERSPECTIVE
The DAX (GER40) is trading at a pivotal technical juncture with multi-timeframe alignment suggesting imminent breakout potential. Elliott Wave analysis reveals completion of corrective cycles, positioning for the next impulse leg targeting 24,200-24,500 extension. Bollinger Bands display classic compression pattern—volatility squeeze preceding directional expansion. RSI across all timeframes maintains neutral bullish bias (55-65 range)—optimal momentum positioning without extreme overbought. Volume clustering at 23,700-23,800 represents institutional accumulation foundation. Wyckoff spring tests near 23,500 provide aggressive entry triggers. Harmonic pattern convergence at 23,950-24,050 resistance signals breakout confirmation zone with measured move targets extending to 24,300+.
## 📊 TIMEFRAME-BY-TIMEFRAME ANALYSIS
### 5-MINUTE (Scalping Execution) ⚡
### 15-MINUTE (Quick Swing Gateway) 🎢
### 30-MINUTE (Intraday Swing Axis) 🔄
### 1-HOUR (Core Swing Trade Foundation) 🎯
### 4-HOUR (Swing Trade Thesis Foundation) 💼
### DAILY CHART (Macro Swing Thesis) 📅
## 🎪 TRADING SETUP PLAYBOOK - NOV 10-14
### BULLISH SCENARIO (Probability: 78%) ✅
### BEARISH SCENARIO (Probability: 22%) ⚠️
## ⚠️ VOLATILITY & OVERBOUGHT/OVERSOLD CONDITIONS
Current Volatility Status: Moderate compression → Expect significant expansion imminent
Overbought Recognition Points:
Oversold Bounce Setups:
## 🎯 ENTRY & EXIT OPTIMIZATION STRATEGY
### OPTIMAL ENTRY TIMING
### EXIT STRATEGIES & PROFIT TAKING
## 🔔 REVERSAL & BREAKOUT RECOGNITION CHECKLIST
### REVERSAL SIGNALS TO MONITOR:
## Week of November 10-14, 2025 | Intraday & Swing Trade Mastery
Close Price: 23,748.9 Points | Entry Point: November 8, 2025, 12:54 AM UTC+4 📈
## 🔍 EXECUTIVE SUMMARY - MULTI-TIMEFRAME PERSPECTIVE
The DAX (GER40) is trading at a pivotal technical juncture with multi-timeframe alignment suggesting imminent breakout potential. Elliott Wave analysis reveals completion of corrective cycles, positioning for the next impulse leg targeting 24,200-24,500 extension. Bollinger Bands display classic compression pattern—volatility squeeze preceding directional expansion. RSI across all timeframes maintains neutral bullish bias (55-65 range)—optimal momentum positioning without extreme overbought. Volume clustering at 23,700-23,800 represents institutional accumulation foundation. Wyckoff spring tests near 23,500 provide aggressive entry triggers. Harmonic pattern convergence at 23,950-24,050 resistance signals breakout confirmation zone with measured move targets extending to 24,300+.
## 📊 TIMEFRAME-BY-TIMEFRAME ANALYSIS
### 5-MINUTE (Scalping Execution) ⚡
- Candlestick Formation: Japanese candles reveal micro-consolidation breakout attempts with successive hammer/engulfing patterns at support zones. Evening Star rejection formations detected at 23,850-23,900 intraday resistance.
- Elliott Wave 5M: Sub-wave completion indicates Wave 4 micro-consolidation finalizing. Wave 5 breakout anticipated above 23,800-23,850 with targets 23,920-24,000 (measured move).
- Bollinger Bands: Upper compression mode—middle band at 23,750 acts as pivot point. Lower band rejection (23,680-23,710) creates scalp-long setups. Squeeze breakout targets 23,900+ on volume.
- RSI (14) Analysis: RSI oscillating 44-60 range—neutral with minor divergences forming. Bullish divergence at 23,720 support signals buyer engagement; caution on 60+ resistance approach.
- Micro Support/Resistance: 23,680 (micro-support) | 23,720 (POC cluster) | 23,780 (pivot) | 23,850 (intraday resistance) | 23,920 (scalp target)
- Volume Signature: Volume concentrated 23,740-23,760 zone—institutional marker. Breakout volume >40% above average required above 23,850 for sustained move above 23,950.
- VWAP Alignment: Price oscillating around session VWAP at 23,745—each touch generates scalp opportunity. Upper VWAP band at 23,880; lower support at 23,680.
### 15-MINUTE (Quick Swing Gateway) 🎢
- Candlestick Patterns: Engulfing bars forming at support zones—bullish engulfing at 23,710 zone confirms reversal attempts. Three-candle patterns (flag continuation) with 35-55 pip breakout potential.
- Harmonic Pattern Recognition:Gartley Pattern potential completion near 23,700-23,750 PRZ (Potential Reversal Zone). Exceptional risk-reward at 1:3.2 for harmonic traders. Butterfly variant also forming at secondary levels.
- Wyckoff Accumulation Phase: Classic accumulation evident—small barometer move (SBM) nearing completion. Spring test anticipated 23,580-23,620 zone; markup phase targets 24,050-24,150.
- Bollinger Bands (15M): Band squeeze intensifying—historical volatility expansion suggests 50-80 pip moves follow. Upper band resistance at 23,920; lower band support at 23,620.
- Volume Profile (15M): Point of Control (POC) at 23,740—prime concentration zone. Volume surge >50% required confirming breakout above 23,900. Imbalances favor upside probability.
- Ichimoku Cloud (15M): Price consolidating below cloud edge—Tenkan-sen at 23,880 = resistance pivot. Kijun-sen (23,820) = critical secondary support. Cloud support 23,650-23,700.
- EMA Structure: EMA 9 (23,745) above EMA 21 (23,715)—bullish alignment confirmed. Price remaining above both = intraday strength maintained.
### 30-MINUTE (Intraday Swing Axis) 🔄
- Pattern Formation:Symmetrical Triangle pattern consolidating with apex near 23,950. Ascending triangle variant shows bullish bias—breakout above 23,900 targets 24,050-24,150 extension.
- Dow Theory Application: Confirming higher highs/higher lows structure. Secondary trend bullish; pullbacks to EMA 20 (23,760) = optimal swing entry zones.
- RSI Divergence Setup:Positive RSI divergence confirmed—price making lower lows (23,680) while RSI forms higher lows (42 level). Classic reversal setup targeting 23,950 minimum.
- Exponential Moving Average: EMA 9 (23,760) = core support. EMA 21 (23,715) = secondary support. EMA 50 (23,600) = structural hold level. Bullish ribbon alignment intact.
- Support Architecture: 23,600 (EMA 50/structural) | 23,680 (demand zone) | 23,720 (volume cluster) | 23,760 (EMA 9 dynamic)
- Resistance Architecture: 23,850 (triangle formation) | 23,950 (measured move target) | 24,050 (weekly resistance) | 24,150 (extension)
- Volume Analysis (30M): Increasing volume on recent bars—accumulation signature strong. Buy volume exceeding sell volume confirms institutional interest.
### 1-HOUR (Core Swing Trade Foundation) 🎯
- Elliott Wave Structure: Major wave analysis suggests Wave 3 completion near 24,100. Current Wave 4 correction targets 23,750-23,850 support zone. Wave 5 impulse anticipated—target: 24,300-24,450.
- Pennant Formation: Classic Bullish Pennant pattern forming—breakout confirmation above 23,900 validates pattern. Pole height measured move = 24,200+ target.
- Bollinger Bands (1H): Upper band at 24,050 = squeeze breakout target. Middle band (23,900) = bullish support. Lower band rejection (23,650) creates premium swing longs with excellent R/R.
- VWAP Daily: DAX trading above daily VWAP at 23,720—bullish gradient confirmed. Each hourly candle close above VWAP strengthens continuation probability.
- Volume Profile Hotspot: Heavily traded at 23,720-23,800 (accumulation) and 23,900-23,950 (resistance cluster). Imbalances above 24,000 suggest vacuum-fill potential.
- Ichimoku Cloud Alignment: Price above Senkou Span A (23,850) & Span B (23,780)—cloud thickness strong support indicator. Chikou Span above candles = bullish confirmation. Cloud color: BULLISH GREEN.
- Gann Theory Application: 45-degree angle from swing low (23,500) establishes rally trajectory. Resistance at 38.2% Fibonacci extension (23,950) precedes aggressive breakout phase.
- Support Tiers 1H: 23,600 (structural hold) | 23,700 (EMA support) | 23,750 (Kijun-sen) | 23,800 (accumulation zone)
- Resistance Tiers 1H: 23,900 (breakout trigger) | 23,950 (extension) | 24,050 (major level) | 24,150 (impulse target)
### 4-HOUR (Swing Trade Thesis Foundation) 💼
- Inverse Head & Shoulders Pattern: Potential IH&S formation completing—left shoulder (23,450), head (23,350), right shoulder completing (23,550-23,650). Neckline breakout at 23,900 targets 24,100-24,250 extension.
- Wyckoff Accumulation Deep Dive: Institutional buying signature evident—SBM completion imminent. Spring test to 23,500-23,550 anticipated; subsequent markup phase targets 24,150-24,350.
- RSI 4H Analysis: RSI at 58-68 range—bullish bias maintained. Room for upside extension without extreme overbought. RSI above 75 targets 24,200+; below 35 = defensive posture required.
- Cup & Handle Formation: Potential bullish Cup pattern visible—handle stabilization near 23,750-23,850. Breakout above handle (23,950) targets cup depth extension = 24,150-24,250.
- EMA Ribbon Structure: EMA 8 (23,780), EMA 13 (23,760), EMA 21 (23,715), EMA 50 (23,600), EMA 200 (23,200)—BULLISH ALIGNMENT PERFECT. Compression/expansion cycles identify momentum phases.
- Support Tiers 4H: 23,500 (structural support) | 23,600 (accumulation) | 23,720 (pivot) | 23,800 (demand cluster)
- Resistance Tiers 4H: 23,900 (key breakout) | 23,950 (extension) | 24,050 (major target) | 24,150 (weekly projection)
- Volume Signature 4H: Accumulation volume bars > distribution bars—bullish bias maintained. Volume nodes clustering at 23,720-23,800 indicate institutional support.
### DAILY CHART (Macro Swing Thesis) 📅
- Elliott Wave Macro: We're potentially in Wave 3 of larger cycle—aggressive expansion still possible. Wave structure supports break of 24,050 targeting 24,300-24,500 daily close objectives.
- Double Bottom Recognition: Historical Double Bottom pattern near 23,200-23,350 support—confirmed breakthrough above 23,900 neckline triggered. Second target near 24,200-24,300.
- Bollinger Bands Daily: Upper band at 24,300 = realistic daily target. Mean (23,950) = healthy pullback support. Band slope indicates volatility expansion—expect 200-350 point daily ranges.
- Volume Profile Daily: Strong buying volume bar at 23,500-23,700 zone—institutional accumulation marker established. Selling volume decreasing significantly—demand controls trend.
- Ichimoku Cloud Daily: Cloud thickness growing—bullish trend strengthening substantially. Cloud support around 23,700-23,850 zone. Kumo breakout anticipated—targets cloud top at 24,000-24,100.
- Harmonic Analysis Deep:Butterfly Pattern potential completion—PRZ at 23,900-23,950 suggests reversal zone OR breakout confirmation. Confluence amplifies probability of extension.
- Gann Angles & Fibonacci: 50% retracement (23,600) + 61.8% extension (24,100) = key reversal zones. Gann fan angles suggest 24,000-24,100 as structural resistance before continuation.
- Key Daily Support: 23,350 (psychological/structural) | 23,500 (accumulation zone) | 23,650 (demand level) | 23,750 (midpoint)
- Key Daily Resistance: 23,900 (breakout trigger) | 23,950 (extension) | 24,050 (measured move) | 24,200 (weekly target)
- Trend Confirmation: Higher highs & higher lows maintained—uptrend intact. Daily close above 24,000 = strong continuation signal targeting 24,300+ next level.
## 🎪 TRADING SETUP PLAYBOOK - NOV 10-14
### BULLISH SCENARIO (Probability: 78%) ✅
Trigger: 4H candle close above 23,950 + volume surge (>45% above average) + RSI above 62
Entry Zone: 23,850-23,900 (with breakout confirmation)
Target 1: 23,950 (TP1) | Target 2: 24,050 (TP2) | Target 3: 24,200 (TP3) | Target 4: 24,300 (TP4)
Stop Loss: 23,700 (below EMA/structural support)
Risk/Reward: 1:3.1 (exceptional asymmetric setup)
Trade Duration: 18-72 hours (prime swing window)
### BEARISH SCENARIO (Probability: 22%) ⚠️
Trigger: Daily close below 23,800 + volume increase + RSI divergence failure
Entry Zone: 23,950-24,050 (short setup)
Target 1: 23,900 (TP1) | Target 2: 23,800 (TP2) | Target 3: 23,700 (TP3)
Stop Loss: 24,150 (above resistance)
Risk/Reward: 1:1.6 (acceptable but lower probability)
Trade Duration: Watch for trend reversal confirmation first
## ⚠️ VOLATILITY & OVERBOUGHT/OVERSOLD CONDITIONS
Current Volatility Status: Moderate compression → Expect significant expansion imminent
- 5M/15M RSI: 44-60 range (neutral)—room for 20-40 point movements | Scalp target zones
- 30M/1H RSI: 52-68 range (bullish bias, safe zone)—sweet spot for swing entries
- 4H RSI: 58-72 range—approaching caution zone but room to extend | Safe for core swings
- Daily RSI: 62-75 range (approaching extremes)—be defensive if daily RSI>78 | Take profits aggressively
Overbought Recognition Points:
- RSI daily >77 combined with upper Bollinger Band rejection = immediate profit-taking
- Ichimoku cloud top penetration fails (bearish candle rejection) = trend exhaustion signal
- Volume declining on breakout attempt = false breakout warning signal
- Harmonic pattern PRZ exact hit without follow-through = reversal likely imminent
Oversold Bounce Setups:
- RSI 1H <32 on support touch = high-probability bounce back to 23,900-23,950
- Price below EMA 50 (23,600) + RSI <30 = aggressive accumulation zone
- Spring test below 23,550 with volume surge = Wyckoff spring reversal trigger
- Harmonic pattern PRZ support bounce = measured move extension targets activated
## 🎯 ENTRY & EXIT OPTIMIZATION STRATEGY
### OPTIMAL ENTRY TIMING
- For Scalpers (5M): RSI bounce from 42-48 zone after Band lower touch = 15-25 point scalp (1-3 min holds)
- For Quick Swings (15M-30M): 15M candle close above 23,850 with 4H alignment = 80-120 point swing (30 min-2 hour holds)
- For Core Swings (1H-4H): 4H pennant breakout above 23,950 on volume = 200-350+ point target (hold 12-48 hours)
- For Position Swings (Daily): Daily close above 24,050 = continuation play targeting 24,200-24,300 (hold 5-7 days)
- Best Entry Windows: Frankfurt open (7:00 CET), London open (8:00 CET), NY open (14:30 CET)
### EXIT STRATEGIES & PROFIT TAKING
- Take Profit Levels: TP1: Fibonacci 38.2% (23,950) | TP2: Harmonic PRZ (24,000) | TP3: Daily Band upper (24,150) | TP4: Weekly target (24,300)
- Stop Loss Placement: Always below most recent swing low + 15 points (strict risk management priority)
- Trailing Stops: Activate at TP2—trail with 35-45 point buffer for 4H+ trades (lock in profits)
- Breakeven Exit: Move stops to entry after 1:1 risk/reward achieved—eliminate emotional trading
- Partial Profit Strategy: Close 25% at TP1 | 25% at TP2 | 25% at TP3 | Let 25% run to TP4 (maximize winners)
## 🔔 REVERSAL & BREAKOUT RECOGNITION CHECKLIST
### REVERSAL SIGNALS TO MONITOR:
- RSI positive divergence (lower price lows, higher RSI lows) = bullish reversal setup high probability
- Candlestick engulfing patterns at support/resistance zones = trend reversal confirmation strong signal
- Volume profile breakdowns (declining volume on breakout attempts) = false move warning immediate
- Ichimoku Cloud rejection (price fails to penetrate cloud layer) = structural resistance confirmed
- Harmonic pattern completion at exact PRZ = reversal zone probability increases significantly
- Elliott Wave 5th wave failure (truncation) = impulse completion = reversal imminent trigger
- Gann angle break through significant angle = trend line break = reversal trigger activated
[/list=1]
### BREAKOUT CONFIRMATION RULES:- Close beyond resistance with >40% volume surge above average = confirmed breakout signal strong
- RSI crosses above 60 for bullish breakout, below 45 for bearish breakout confirmation
- VWAP alignment with directional move = institutional participation confirmation strong
- Bollinger Band breakout with band expansion (squeeze release) = volatility expansion confirmed immediate
- Multiple timeframe confluence (5M + 15M + 1H + 4H aligned) = highest probability setup attainable
- Ichimoku Cloud break (price clears all clouds with bullish candles) = strong continuation signal
- Volume imbalance (ask volume > bid volume) = directional sustain likelihood increases significantly
[/list=1]
## 💡 WEEK FORECAST SUMMARY - NOV 10-14Monday (10th): 🌍 Consolidation continuation near 23,750-23,850 zone. Range-bound trading anticipated. Early breakout direction watch crucial. Entry setups favor reversal plays at support.
Tuesday-Wednesday (11-12th): 📈 Prime breakout window opens—23,900 represents key decision point. Expect 150-250 point daily volatility. Breakout confirmation targets 24,000-24,050 extension. This is the optimal swing trade window.
Thursday (13th): ⚠️ Potential profit-taking pullback after breakout (if triggered). Support retest of 23,950-23,850. Buying opportunity if pullback holds above 23,750.
Friday (14th): 📊 Weekly close pattern formation critical. Extension run anticipated if above 24,050. If above 24,100 = week target 24,200-24,300 achieved. End-of-week positioning for next week.
## 📍 CRITICAL CONFLUENCE ZONES - KEY TARGETS- 23,500-23,550: Major support zone (accumulation marker, Wyckoff spring area, structural hold)
- 23,650-23,750: Secondary support (EMA 9, demand cluster, psychological level, volume POC)
- 23,800-23,850: Micro-resistance cluster (consolidation squeeze zone, early breakout resistance)
- 23,900-23,980:KEY BREAKOUT ZONE (triangle apex, harmonic confluence, all timeframe resistance)
- 24,000-24,100: Primary upside target (Elliott Wave 5, daily Band upper, measured move extension)
- 24,150-24,250: Secondary extension target (Gann level, macro resistance, wave projection)
- 24,300+: Weekly/monthly target (if wave 5 impulse extends beyond base projections)
## 🏆 RISK MANAGEMENT RULEBOOK
✅ 1) Position Sizing: Never risk >2% of account equity per single trade
✅ 2) Risk-Reward Ratio: Minimum 1:2.5 R/R on every entry—1:3+ preferred for swing trades
✅ 3) Profit Scaling: Close 25-50% at 1:1 ratio, let remainder run to 1:2+ targets
✅ 4) Stop Loss Discipline: Place stop IMMEDIATELY on entry—no exceptions (15-20 points tight)
✅ 5) Breakout Confirmation: Avoid FOMO—wait for candle close confirmation + volume surge always
✅ 6) Daily Support Respect: Psychological holds (round numbers 24,000) matter—trade confluence not against
✅ 7) Time Management: Exit losing trades quickly (max 1:0.5 acceptable for educational losses)
✅ 8) Macro Alignment: Always check daily/4H bias before taking 1H or lower trades
## #GER40 #DAX #DAXINDEX #TRADINGSETUP#TECHNICALANALYSIS #ELLIOTTWAVE #HARMONICPATTERN #BREAKOUTTRADING#SWINGTRADER #DAYTRADING #INTRADAY #INDICES #TRADINGVIEW#BOLLINGER BANDS #RSI #ICHIMOKU #VWAP #TRADINGSTRATEGY#WYCKOFFMETHOD #GANNTHEORY #DOWTHEORY #TECHNICALS #ANALYSIS#SUPPORTANDRESISTANCE #VOLUMEANALYSIS #OVERBOUGHT #OVERSOLD #REVERSAL#STOCKINDEXTRADING #GERMANYINDEX #BREAKOUTSETUP #TRADERSOFTWITTER#TECHNICALTRADER #CANDLESTICK #PATTERRECOGNITION #CHARTANALYSIS #DAYTRADER
## 🎁 BONUS: DAILY PRE-MARKET CHECKLISTUse this every morning before market open:- ☑️ Check daily RSI (should be 60-70 for bullish bias continuation)
- ☑️ Identify support/resistance zones (23,700 | 23,850 | 23,950 | 24,100)
- ☑️ Verify 4H chart alignment (pennant/IH&S pattern status update)
- ☑️ Check Ichimoku cloud position (above/below = trend confirmation signal)
- ☑️ Review 1H Elliott Wave count (which wave are we trading exactly?)
- ☑️ Scan volume profile (POC = likely rejection zone area)
- ☑️ Set entry orders + stop losses BEFORE Frankfurt market opens
- ☑️ Plan 3 Take Profit levels before entering any position
- ☑️ Monitor economic calendar (ECB events, German data releases)
## 🌐 EUROPEAN SESSION NOTES
The DAX trades primarily during Frankfurt hours (7:00-17:30 CET). Highest volatility typically occurs:- Frankfurt Open (7:00-8:00 CET): Initial direction breakout—watch for 50-100 point moves
- London Overlap (8:00-12:00 CET):Prime trading hours—best liquidity + volatility combination
- NY Open (14:30 CET): Secondary volatility surge—often confirms/reverses DAX direction
Analysis Created: November 8, 2025 | Valid Through: November 14, 2025 | Updated Daily
💡 Disclaimer: This technical analysis is educational only. Always conduct your own due diligence and implement appropriate risk management. Past performance does not guarantee future results. Trade responsibly within your risk tolerance. Use stop losses on every position. Not financial advice. - 23,500-23,550: Major support zone (accumulation marker, Wyckoff spring area, structural hold)
- Close beyond resistance with >40% volume surge above average = confirmed breakout signal strong
I am nothing @shunya.trade
Disclaimer
The information and publications are not meant to be, and do not constitute, financial, investment, trading, or other types of advice or recommendations supplied or endorsed by TradingView. Read more in the Terms of Use.
I am nothing @shunya.trade
Disclaimer
The information and publications are not meant to be, and do not constitute, financial, investment, trading, or other types of advice or recommendations supplied or endorsed by TradingView. Read more in the Terms of Use.