1. Current Price Structure
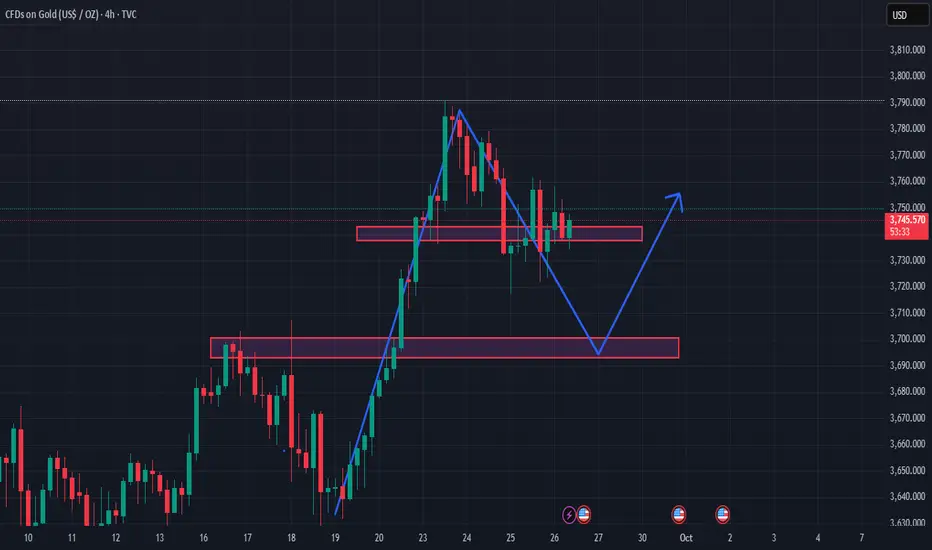
Gold has formed a strong bullish wave (rallying from the 3,680 zone to nearly 3,790).
Afterwards, a sharp decline occurred → creating a new high but quickly rejected.
At present, the price is consolidating sideways within a narrow support–resistance zone around 3,740 – 3,755.
2. Key Support – Resistance Levels
Near-term resistance: 3,755 – 3,760 (recent minor high).
Near-term support: 3,735 – 3,740 (area repeatedly tested).
Stronger support: 3,695 – 3,705 (potential retracement target with liquidity and previous accumulation zone).
3. Price Scenarios
Scenario 1 (primary): Price breaks below the current support → drops to retest the 3,695 – 3,705 zone → then bounces back up. This is a potential “demand zone” where buyers may return.
Scenario 2 (less likely): Price holds the 3,740 support and rallies immediately → however, current buying pressure seems insufficient to sustain this move.
4. Trading Implications
The 3,695 – 3,705 zone is a potential buy area if bullish reversal candlestick patterns appear.
If price clearly breaks below 3,695, the short-term trend could turn bearish with a target toward 3,660.
In the short term, the market is still in a corrective phase after the previous bullish rally → not ideal to “chase buys” around 3,740.
👉 In summary: The chart suggests the price is more likely to dip toward the 3,700 demand zone before bouncing back up. The 3,740 zone is only a temporary buffer, not strong enough for a major reversal.
✅MY FREE FOREX & XAUUSD SIGNALS TELEGRAM CHANNEL:
t.me/+xkPoUfOB8BsyMzRl
🔴9-12 signals per day
🔴Free knowledge support
🔴24/7 support for newbies.
🔴You always have priority.
FXWARRIOR 😘
t.me/+xkPoUfOB8BsyMzRl
🔴9-12 signals per day
🔴Free knowledge support
🔴24/7 support for newbies.
🔴You always have priority.
FXWARRIOR 😘
Related publications
Disclaimer
The information and publications are not meant to be, and do not constitute, financial, investment, trading, or other types of advice or recommendations supplied or endorsed by TradingView. Read more in the Terms of Use.