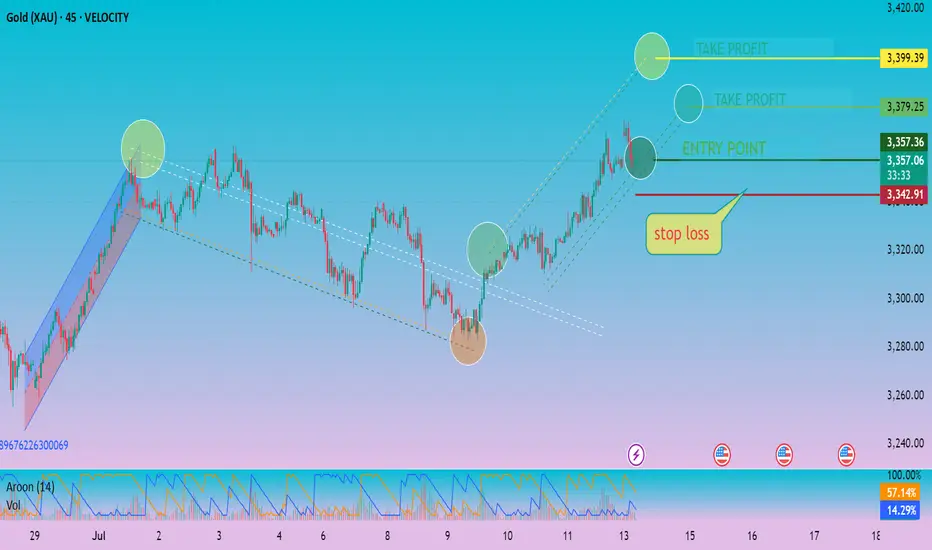
This chart is a technical analysis of Gold (XAU/USD) on a 45-minute timeframe using TradingView, as of July 14, 2025. It includes indicators, price action patterns, trend channels, and annotated trading levels.
---
🔍 1. Chart Overview
Asset: Gold (XAU/USD)
Timeframe: 45-minute
Current Price: ~$3,357.43
Trend Bias: Bullish in the short term (current price is rising within an ascending channel)
---
📈 2. Trend & Price Action
✅ Uptrend Formation
The chart shows a downtrend reversal around July 9, with the price forming a V-shaped recovery.
The breakout from the descending channel around July 9 marks the reversal confirmation.
Price is now trading in an ascending parallel channel, indicating a bullish trend.
✅ Entry Point
The ENTRY POINT is marked at ~3,357.36.
This was identified after a strong breakout and retest of the ascending channel support.
❗ Stop Loss
Stop Loss: Placed at ~3,342.91, just below the lower bound of the ascending channel.
It’s a reasonable level to cut losses if the price drops below key support.
---
🎯 3. Take Profit Levels
There are two take profit (TP) levels:
Target Level Notes
TP1 3,379.25 Conservative target within channel
TP2 3,399.39 Aggressive target at channel top
Both are logical based on channel projection and recent highs.
---
📊 4. Indicators & Volume
📉 Aroon Indicator (bottom pane)
Aroon Up (blue): ~14%
Aroon Down (orange): ~57%
This shows recent bullish strength is weakening, but no strong trend reversal yet.
🔊 Volume
Steady volume, no sharp spikes indicating overbought conditions.
Volume increased slightly on the breakout, confirming the strength of the bullish move.
---
📐 5. Patterns and Tools
Falling Channel: Broken upward, which often indicates a bullish reversal.
Rising Channel (current): Being respected; price is climbing within this channel.
Support & Resistance: Well-defined entry, SL, and TP levels.
Highlight Circles: Emphasize key turning points and breakout zones.
---
🧠 6. Strategy Summary
🟩 Bullish Setup
Entry: Taken after breakout and confirmation.
Stop Loss: Strategically placed to minimize risk.
Profit Targets: Allow scaling out based on risk tolerance.
---
⚠ 7. Risks & Considerations
The Aroon indicator shows fading bullish momentum.
If price breaks below the lower ascending channel line, consider exiting or re-evaluating.
Watch for volume spikes or reversal candles near the TP zones.
---
✅ Conclusion
This chart suggests a well-structured long (buy) trade based on:
Technical breakout
Channel formation
Defined entry/exit points
As long as price remains above ~3,343, the bullish outlook is valid. Be cautious around resistance levels (~3,379 and ~3,399), and adjust SL or TP dynamically if volatility increases.
Let me know if you want a trade plan or risk-reward ratio breakdown.
---
🔍 1. Chart Overview
Asset: Gold (XAU/USD)
Timeframe: 45-minute
Current Price: ~$3,357.43
Trend Bias: Bullish in the short term (current price is rising within an ascending channel)
---
📈 2. Trend & Price Action
✅ Uptrend Formation
The chart shows a downtrend reversal around July 9, with the price forming a V-shaped recovery.
The breakout from the descending channel around July 9 marks the reversal confirmation.
Price is now trading in an ascending parallel channel, indicating a bullish trend.
✅ Entry Point
The ENTRY POINT is marked at ~3,357.36.
This was identified after a strong breakout and retest of the ascending channel support.
❗ Stop Loss
Stop Loss: Placed at ~3,342.91, just below the lower bound of the ascending channel.
It’s a reasonable level to cut losses if the price drops below key support.
---
🎯 3. Take Profit Levels
There are two take profit (TP) levels:
Target Level Notes
TP1 3,379.25 Conservative target within channel
TP2 3,399.39 Aggressive target at channel top
Both are logical based on channel projection and recent highs.
---
📊 4. Indicators & Volume
📉 Aroon Indicator (bottom pane)
Aroon Up (blue): ~14%
Aroon Down (orange): ~57%
This shows recent bullish strength is weakening, but no strong trend reversal yet.
🔊 Volume
Steady volume, no sharp spikes indicating overbought conditions.
Volume increased slightly on the breakout, confirming the strength of the bullish move.
---
📐 5. Patterns and Tools
Falling Channel: Broken upward, which often indicates a bullish reversal.
Rising Channel (current): Being respected; price is climbing within this channel.
Support & Resistance: Well-defined entry, SL, and TP levels.
Highlight Circles: Emphasize key turning points and breakout zones.
---
🧠 6. Strategy Summary
🟩 Bullish Setup
Entry: Taken after breakout and confirmation.
Stop Loss: Strategically placed to minimize risk.
Profit Targets: Allow scaling out based on risk tolerance.
---
⚠ 7. Risks & Considerations
The Aroon indicator shows fading bullish momentum.
If price breaks below the lower ascending channel line, consider exiting or re-evaluating.
Watch for volume spikes or reversal candles near the TP zones.
---
✅ Conclusion
This chart suggests a well-structured long (buy) trade based on:
Technical breakout
Channel formation
Defined entry/exit points
As long as price remains above ~3,343, the bullish outlook is valid. Be cautious around resistance levels (~3,379 and ~3,399), and adjust SL or TP dynamically if volatility increases.
Let me know if you want a trade plan or risk-reward ratio breakdown.
Disclaimer
The information and publications are not meant to be, and do not constitute, financial, investment, trading, or other types of advice or recommendations supplied or endorsed by TradingView. Read more in the Terms of Use.
Disclaimer
The information and publications are not meant to be, and do not constitute, financial, investment, trading, or other types of advice or recommendations supplied or endorsed by TradingView. Read more in the Terms of Use.