🟡 Gold (XAU/USD) Technical Outlook – Strong Bullish Trend Near All-Time Highs
📊 Market Overview
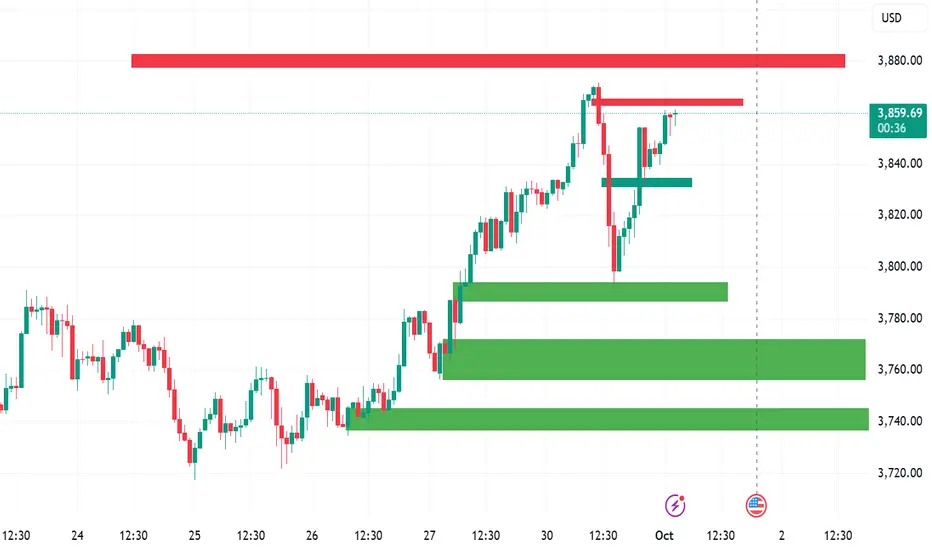
Current Price: ~3,858.55
Trend: Strong Bullish
Technical Summary:
Moving Averages → Strong Buy
Indicators → Strong Buy
Overall Signal → Strong Buy
🔑 Key Levels
Support Zones:
3,854.88 → (Today’s Low)
3,840 – 3,845 → (Previous Support)
3,788 – 3,800 → (Major Zone)
Resistance Levels:
3,861.41 → (Today’s High)
3,871.72 → (52-Week High)
3,934 → (Fibonacci Target)
Pivot Points (Classic):
S1: 3,852.81
Pivot: 3,856.48
R1: 3,862.13
📈 Technical Analysis Deep Dive
Trend Analysis:
Gold is trading well above all major SMAs & EMAs (5–200 days) → confirms strong uptrend.
Price structure shows higher highs & higher lows → bullish momentum intact.
Momentum Indicators:
RSI (14) → 60.49, bullish but not yet overbought.
Stochastic (9,6) → overbought → signals risk of short-term pullback before continuation.
Market Drivers:
Fed’s dovish stance
Weakening U.S. Dollar
Safe-haven demand from geopolitical tensions
💡 Trading Strategy
✅ Breakout Strategy
Watch for a decisive break above 3,861.41 → possible rally towards 3,871.72 (52W high) and 3,934 (Fib projection).
✅ Pullback Strategy
Safer approach → wait for dip towards:
3,840 – 3,845 zone
3,788 – 3,800 zone (major support)
⚠️ Risk Management
Suggested stop-loss → below 3,840 for entries near 3,850.
Bullish outlook invalidated only if price drops below 3,735.
📌 Conclusion
Gold remains in a strong bullish trend supported by both technicals and fundamentals. While a short-term pullback is possible, the broader outlook favors buying on dips or breakouts towards new highs
📊 Market Overview
Current Price: ~3,858.55
Trend: Strong Bullish
Technical Summary:
Moving Averages → Strong Buy
Indicators → Strong Buy
Overall Signal → Strong Buy
🔑 Key Levels
Support Zones:
3,854.88 → (Today’s Low)
3,840 – 3,845 → (Previous Support)
3,788 – 3,800 → (Major Zone)
Resistance Levels:
3,861.41 → (Today’s High)
3,871.72 → (52-Week High)
3,934 → (Fibonacci Target)
Pivot Points (Classic):
S1: 3,852.81
Pivot: 3,856.48
R1: 3,862.13
📈 Technical Analysis Deep Dive
Trend Analysis:
Gold is trading well above all major SMAs & EMAs (5–200 days) → confirms strong uptrend.
Price structure shows higher highs & higher lows → bullish momentum intact.
Momentum Indicators:
RSI (14) → 60.49, bullish but not yet overbought.
Stochastic (9,6) → overbought → signals risk of short-term pullback before continuation.
Market Drivers:
Fed’s dovish stance
Weakening U.S. Dollar
Safe-haven demand from geopolitical tensions
💡 Trading Strategy
✅ Breakout Strategy
Watch for a decisive break above 3,861.41 → possible rally towards 3,871.72 (52W high) and 3,934 (Fib projection).
✅ Pullback Strategy
Safer approach → wait for dip towards:
3,840 – 3,845 zone
3,788 – 3,800 zone (major support)
⚠️ Risk Management
Suggested stop-loss → below 3,840 for entries near 3,850.
Bullish outlook invalidated only if price drops below 3,735.
📌 Conclusion
Gold remains in a strong bullish trend supported by both technicals and fundamentals. While a short-term pullback is possible, the broader outlook favors buying on dips or breakouts towards new highs
Disclaimer
The information and publications are not meant to be, and do not constitute, financial, investment, trading, or other types of advice or recommendations supplied or endorsed by TradingView. Read more in the Terms of Use.
Disclaimer
The information and publications are not meant to be, and do not constitute, financial, investment, trading, or other types of advice or recommendations supplied or endorsed by TradingView. Read more in the Terms of Use.