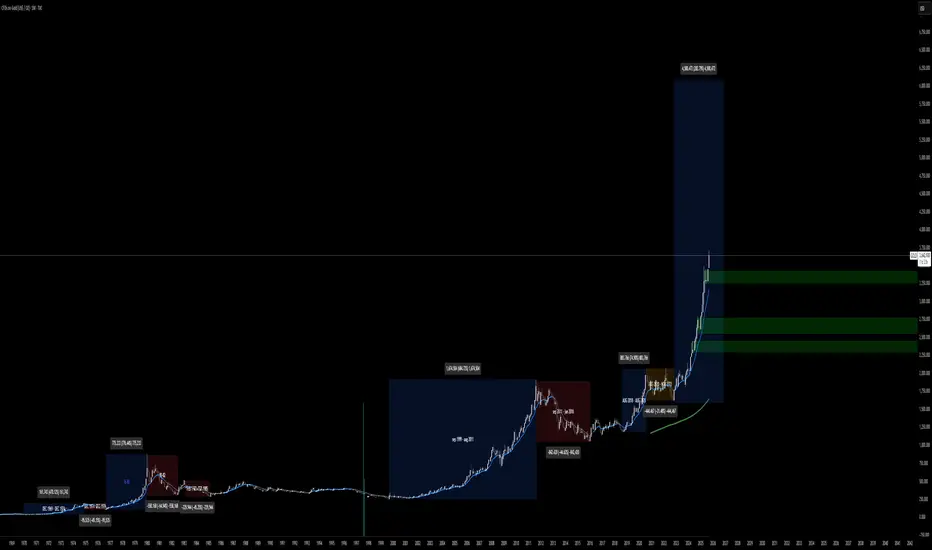
Looking at gold’s historical price action, one thing is clear: every major bull cycle has been followed by extended consolidations before the next explosive leg higher. The current chart structure mirrors past accumulation and breakout phases, but on a much larger scale.
Historic Cycles: Gold has repeatedly shown 5–10x expansions from cyclical lows. The late 1970s, early 2000s, and the post-2018 rally all followed similar exponential patterns.
Consolidation Complete: After the 2011–2015 correction and the 2020–2022 choppiness, gold has broken out decisively, confirming new momentum.
Exponential Curve: The long-term logarithmic growth channel suggests we are in the steepest phase of the curve — the parabolic extension.
📈 Projection: If gold continues following its historical rhythm, we are on track for a powerful multi-year rally that could extend until November 2026. The trajectory points toward several thousand dollars higher per ounce, with new all-time highs unfolding over the next 12–24 months.
💡 Why Now?
Central bank demand is at record highs.
Real interest rates remain structurally pressured.
Geopolitical instability and currency debasement narratives continue to push safe-haven demand.
Supply growth is stagnant, with major new mines years away from production.
Conclusion:
Gold is no longer just creeping higher — it’s breaking into a new exponential phase. The technicals and fundamentals are aligned for a bullish supercycle, and if history repeats, the blow-off could run until late 2026 before any major top forms.
Disclaimer
The information and publications are not meant to be, and do not constitute, financial, investment, trading, or other types of advice or recommendations supplied or endorsed by TradingView. Read more in the Terms of Use.
Disclaimer
The information and publications are not meant to be, and do not constitute, financial, investment, trading, or other types of advice or recommendations supplied or endorsed by TradingView. Read more in the Terms of Use.