🟡 1. Chart Title
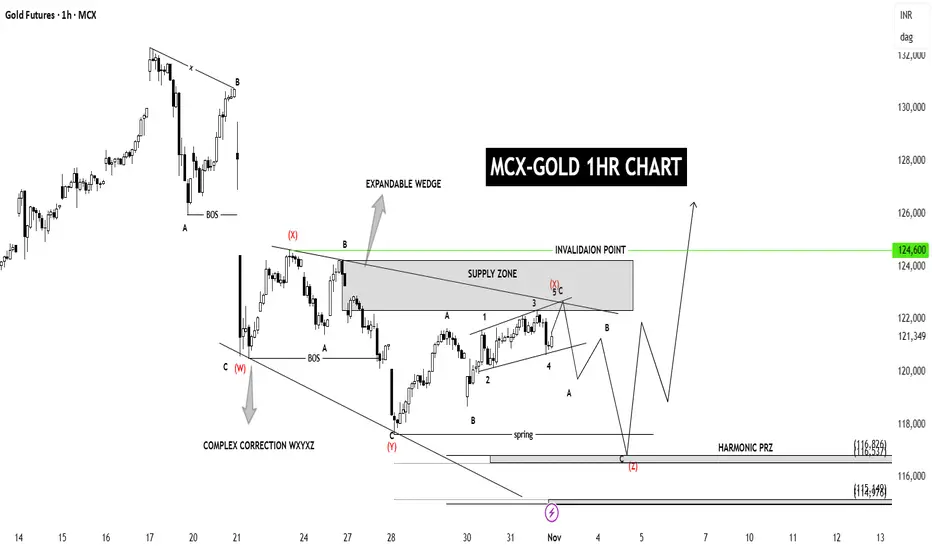
“MCX-GOLD 1HR CHART” — This means the analysis is based on each candle representing 1 hour of price action.
⸻
⚙ 2. Structure Breakdown
• Complex Correction (W–X–Y–X–Z):
This shows that gold has been in a corrective phase, not an impulsive move.
The correction is labeled as a WXYXZ structure — a complex sideways/downward correction with multiple swings.
• Expandable Wedge:
The pattern shows an expanding shape, meaning each swing is getting slightly larger.
This is a sign of high volatility and often forms before a major breakout.
⸻
⚫ 3. Key Zones
• Supply Zone (around ₹124,000–₹124,600):
This is where sellers are expected to enter the market, possibly pushing the price down again.
• Invalidation Point (₹124,600):
If the price goes above ₹124,600, this current bearish correction view is invalidated, and a bullish breakout could start.
• Harmonic PRZ (Potential Reversal Zone):
Located around ₹116,800 – ₹113,400, marked at the bottom of the chart.
This is a buy zone (demand area) based on harmonic projection — expecting the price to reverse upward from this region.
⸻
🔁 4. Elliott Wave Labels
• Current correction labeled as Wave (4) —
After completion, a strong Wave (5) impulse upward is expected.
• Sub-waves (a–b–c) are drawn within the correction to show smaller internal movements.
⸻
📉 5. Expected Move
The chart shows two possible paths:
1. Short-term bearish move —
Price may fall from the supply zone (~₹122,000–₹124,000) to the harmonic PRZ around ₹117,000.
2. Then bullish reversal —
From the PRZ, the chart expects a strong upside rally, possibly toward ₹126,000+.
Disclaimer
The information and publications are not meant to be, and do not constitute, financial, investment, trading, or other types of advice or recommendations supplied or endorsed by TradingView. Read more in the Terms of Use.
Disclaimer
The information and publications are not meant to be, and do not constitute, financial, investment, trading, or other types of advice or recommendations supplied or endorsed by TradingView. Read more in the Terms of Use.