⚡ Overview
Recently, the charts of all major tech giants — Apple, Amazon, Google, Meta, and Microsoft — have started to look almost identical.
Each of them seems to be either topping out or entering what looks like a distribution phase.
In this post, I’ll share my technical and fundamental outlook on Google (GOOG, GOOGL), along with the key risks and price zones I’m watching as a trader.
💡 Fundamental View

From a fundamental perspective, Google still looks strong:
So fundamentally, this is not a bubble.
By Peter Lynch’s fair value formula, Google remains fairly valued, maybe even with a modest upside left.
However, strong fundamentals don’t always mean big growth ahead — especially when the market has already priced in perfection.
And that’s typically when the distribution phase begins.
📈 Technical View

According to Elliott Wave Theory, Google seems to be completing the fifth sub-wave within a larger third wave —
a structure that often marks the final stage before a distribution or correction phase.
On the long-term chart, price is now approaching the upper boundary of the rising channel,
with limited upside potential — possibly up to $430–$450, which represents the top zone.
Beyond that, the probability of continued growth drops sharply, while correction risk increases significantly.
⚙️ Market Structure

When analyzing the volume profile, the largest accumulation zone sits around $15 – $16 —
that’s where long-term investors entered 15 years ago.
Those early buyers are now sitting on massive unrealized profits,
and many are gradually distributing (selling) positions into current strength.
Meanwhile, retail traders often see the ongoing move as “more upside ahead.”
But in reality, this could be the final buying climax before a deeper correction.
🧩 Cycle Context
Interestingly, the same pattern is visible across Apple, Meta, Amazon, and Microsoft.
It’s not just about one stock — the entire Big Tech segment appears to be entering a similar maturity stage of the cycle.
That’s why I believe Google could soon transition from markup to distribution,
followed by a potential multi-quarter sideways or corrective phase.
💬 What’s your take? Do you think Google will reach $400 before correcting — or has the top already formed?
👇 Share your view in the comments.
Recently, the charts of all major tech giants — Apple, Amazon, Google, Meta, and Microsoft — have started to look almost identical.
Each of them seems to be either topping out or entering what looks like a distribution phase.
In this post, I’ll share my technical and fundamental outlook on Google (GOOG, GOOGL), along with the key risks and price zones I’m watching as a trader.
💡 Fundamental View
From a fundamental perspective, Google still looks strong:
- The P/E ratio has been growing steadily.
- Revenue continues to rise.
- The company has been aggressively buying back shares for years.
So fundamentally, this is not a bubble.
By Peter Lynch’s fair value formula, Google remains fairly valued, maybe even with a modest upside left.
However, strong fundamentals don’t always mean big growth ahead — especially when the market has already priced in perfection.
And that’s typically when the distribution phase begins.
📈 Technical View
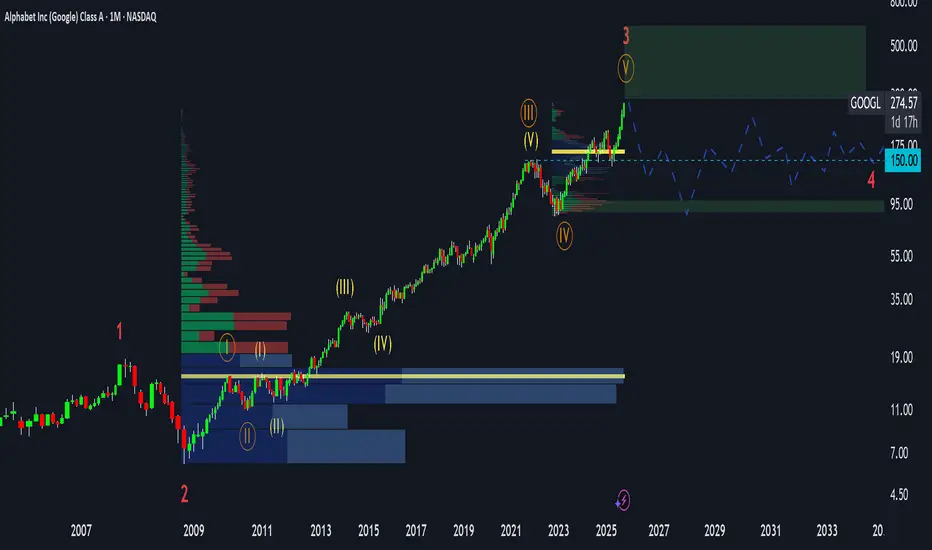
According to Elliott Wave Theory, Google seems to be completing the fifth sub-wave within a larger third wave —
a structure that often marks the final stage before a distribution or correction phase.
On the long-term chart, price is now approaching the upper boundary of the rising channel,
with limited upside potential — possibly up to $430–$450, which represents the top zone.
Beyond that, the probability of continued growth drops sharply, while correction risk increases significantly.
⚙️ Market Structure
When analyzing the volume profile, the largest accumulation zone sits around $15 – $16 —
that’s where long-term investors entered 15 years ago.
Those early buyers are now sitting on massive unrealized profits,
and many are gradually distributing (selling) positions into current strength.
Meanwhile, retail traders often see the ongoing move as “more upside ahead.”
But in reality, this could be the final buying climax before a deeper correction.
🧩 Cycle Context
Interestingly, the same pattern is visible across Apple, Meta, Amazon, and Microsoft.
It’s not just about one stock — the entire Big Tech segment appears to be entering a similar maturity stage of the cycle.
That’s why I believe Google could soon transition from markup to distribution,
followed by a potential multi-quarter sideways or corrective phase.
💬 What’s your take? Do you think Google will reach $400 before correcting — or has the top already formed?
👇 Share your view in the comments.
📈 Weekly stock forecasts & trading insights on Tesla, NVDA, SPY, AAPL and more.
🎥 Watch full analysis on YouTube → youtube.com/@sdkstockscenarios
— subscribe for updates!
🎥 Watch full analysis on YouTube → youtube.com/@sdkstockscenarios
— subscribe for updates!
Related publications
Disclaimer
The information and publications are not meant to be, and do not constitute, financial, investment, trading, or other types of advice or recommendations supplied or endorsed by TradingView. Read more in the Terms of Use.