Google parent Alphabet  GOOG GOOGL is set to report Q3 results this week at a time when the tech giant's stock is trading at or near all-time highs and has risen some 90% since its April lows. The stock has beaten the S&P 500
  SPX in virtually every time period from the past one month to the previous five years. What does its chart and fundamental analysis say?
Let's see:
Alphabet's Fundamental Analysis
GOOGL plans to release quarterly numbers after the closing bell on Wednesday, with the Street expecting the firm to report $2.28 of GAAP earnings per share on slightly more than $100 billion of revenue.
If correct, those numbers would compare well with Alphabet's year-ago comps, with GAAP EPS rising 7.5% from Q3 2024's $2.12 and revenue gaining about 13.4% from the $88.3 billion GOOGL that reported 12 months earlier.
Revenue growth like that would be in line with Alphabet's sales trends for years now.
In fact, 28 of the 49 sell-side analysts that I know of that cover GOOGL have revised their earnings estimates higher since the period started. (Fourteen lowered their forecasts and seven have left their numbers unchanged.)
Alphabet's Technical Analysis
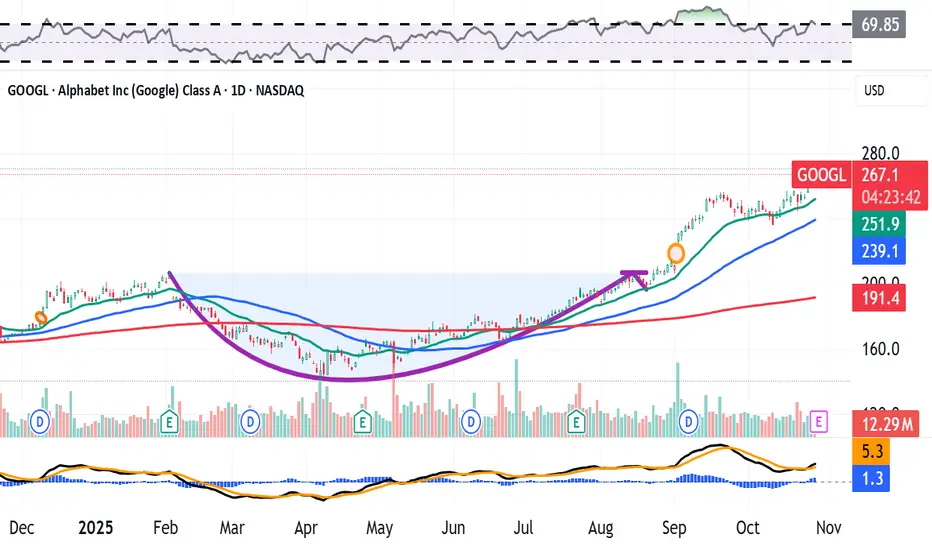
Next, let's look at GOOGL's chart going back some 11 months and running through Friday afternoon:

Readers will first note the large, well-defined cup-with-handle pattern that stretched from late January into August, marked with a purple curving line at the chart's center. That pattern provided GOOGL with a breakout in early September from a $106 pivot.
However, Alphabet hit resistance by late September and spent about a month developing a bull-flag pattern of bullish continuance, marked with two purple diagonal lines and a purple box at the chart's right.
This flag has a $256 pivot, which GOOGL broke through in recent days. (The stock closed $269.24 on Monday after hitting a $270.06 all-time intraday high.)
Should Alphabet manage to hold that pivot, then many analysts likely would adjust their price targets considerably higher. But should the pivot fail, GOOGL would next look to its moving averages for support.
The swing crowd would likely come into play at the stock's 21-day Exponential Moving Average (or "EMA," marked with a green line). Meanwhile, portfolio managers would be down around the 50-day Simple Moving Average (or "SMA," marked with a blue line at $236.60 in the chart above) if not forced to chase on momentum.
Looking at the Alphabet's secondary technical indicators, the stock's Relative Strength Index (the gray line at the chart's top) is quite robust, but not yet in a technically overbought state.
At the same time, Alphabet's daily Moving Average Convergence Divergence indicator (or "MACD," marked with black and gold lines and blue bars at the chart's bottom), looks like it might be trying to take on a more bullish posture.
The histogram of the 9-day EMA (the blue bars) has just moved back into positive territory. That's short-term bullish.
Similarly, the 12-day EMA (the black line) has just crossed above the 26-day EMA (the gold line), with both lines above the zero-bound. That, too, is a short- to medium-term bullish technical signal.
An Options Option
Investors exploring options strategies might consider evaluating a "bull-call spread," depending on their market outlook. That's where you buy one call and sell a second one with a higher strike price and the same expiration date.
Here's an example:
-- Buy one GOOGL $262.50 call with an Oct. 31 expiration (i.e., after the earnings come out). This costs about $8.45 at recent prices.
-- Sell (write) one Oct. 31 GOOGL $282.50 call for roughly $2.30.
Net debit: $6.15
The options trader in this example is risking $6.15 to try to make $13.85, for a 225% maximum profit.
If said trader is also interested in taking on equity risk at a discount, the person could also add a put to the above trade. Example:
-- Sell (write) one Oct. 31 GOOGL $252.50 put for about $5.
This would reduce the trader's net debit to $1.15. While this greatly enhances the spread's potential profitability, the trader is exposed to possibly having to purchase 100 GOOGL shares at expiration at $253.65 net basis at a time when the stock would be trading below $252.50.
The maximum theoretical gain would increase to $18.85 x 100 (options multiplier) for a total of $1,885. The maximum theoretical loss would also increase substantially to $25,365, as although unlikely, the stock could potentially fall to zero.
(Moomoo Technologies Inc. Markets Commentator Stephen "Sarge" Guilfoyle was long GOOGL at the time of writing this column.)
This article discusses technical analysis, other approaches, including fundamental analysis, may offer very different views. The examples provided are for illustrative purposes only and are not intended to be reflective of the results you can expect to achieve. Specific security charts used are for illustrative purposes only and are not a recommendation, offer to sell, or a solicitation of an offer to buy any security. Past investment performance does not indicate or guarantee future success. Returns will vary, and all investments carry risks, including loss of principal. This content is also not a research report and is not intended to serve as the basis for any investment decision. The information contained in this article does not purport to be a complete description of the securities, markets, or developments referred to in this material. Moomoo and its affiliates make no representation or warranty as to the article's adequacy, completeness, accuracy or timeliness for any particular purpose of the above content. Furthermore, there is no guarantee that any statements, estimates, price targets, opinions or forecasts provided herein will prove to be correct.
Options trading is risky and not appropriate for everyone. Read the Options Disclosure Document (https://j.moomoo.com/017y9J) before trading. Options are complex and you may quickly lose the entire investment. Supporting docs for any claims will be furnished upon request.
Options trading subject to eligibility requirements. Strategies available will depend on options level approved.
Maximum potential loss and profit for options are calculated based on the single leg or an entire multi-leg trade remaining intact until expiration with no option contracts being exercised or assigned. These figures do not account for a portion of a multi-leg strategy being changed or removed or the trader assuming a short or long position in the underlying stock at or before expiration. Therefore, it is possible to lose more than the theoretical max loss of a strategy.
Moomoo is a financial information and trading app offered by Moomoo Technologies Inc. In the U.S., investment products and services on Moomoo are offered by Moomoo Financial Inc., Member FINRA/SIPC.
TradingView is an independent third party not affiliated with Moomoo Financial Inc., Moomoo Technologies Inc., or its affiliates. Moomoo Financial Inc. and its affiliates do not endorse, represent or warrant the completeness and accuracy of the data and information available on the TradingView platform and are not responsible for any services provided by the third-party platform.
Let's see:
Alphabet's Fundamental Analysis
GOOGL plans to release quarterly numbers after the closing bell on Wednesday, with the Street expecting the firm to report $2.28 of GAAP earnings per share on slightly more than $100 billion of revenue.
If correct, those numbers would compare well with Alphabet's year-ago comps, with GAAP EPS rising 7.5% from Q3 2024's $2.12 and revenue gaining about 13.4% from the $88.3 billion GOOGL that reported 12 months earlier.
Revenue growth like that would be in line with Alphabet's sales trends for years now.
In fact, 28 of the 49 sell-side analysts that I know of that cover GOOGL have revised their earnings estimates higher since the period started. (Fourteen lowered their forecasts and seven have left their numbers unchanged.)
Alphabet's Technical Analysis
Next, let's look at GOOGL's chart going back some 11 months and running through Friday afternoon:
Readers will first note the large, well-defined cup-with-handle pattern that stretched from late January into August, marked with a purple curving line at the chart's center. That pattern provided GOOGL with a breakout in early September from a $106 pivot.
However, Alphabet hit resistance by late September and spent about a month developing a bull-flag pattern of bullish continuance, marked with two purple diagonal lines and a purple box at the chart's right.
This flag has a $256 pivot, which GOOGL broke through in recent days. (The stock closed $269.24 on Monday after hitting a $270.06 all-time intraday high.)
Should Alphabet manage to hold that pivot, then many analysts likely would adjust their price targets considerably higher. But should the pivot fail, GOOGL would next look to its moving averages for support.
The swing crowd would likely come into play at the stock's 21-day Exponential Moving Average (or "EMA," marked with a green line). Meanwhile, portfolio managers would be down around the 50-day Simple Moving Average (or "SMA," marked with a blue line at $236.60 in the chart above) if not forced to chase on momentum.
Looking at the Alphabet's secondary technical indicators, the stock's Relative Strength Index (the gray line at the chart's top) is quite robust, but not yet in a technically overbought state.
At the same time, Alphabet's daily Moving Average Convergence Divergence indicator (or "MACD," marked with black and gold lines and blue bars at the chart's bottom), looks like it might be trying to take on a more bullish posture.
The histogram of the 9-day EMA (the blue bars) has just moved back into positive territory. That's short-term bullish.
Similarly, the 12-day EMA (the black line) has just crossed above the 26-day EMA (the gold line), with both lines above the zero-bound. That, too, is a short- to medium-term bullish technical signal.
An Options Option
Investors exploring options strategies might consider evaluating a "bull-call spread," depending on their market outlook. That's where you buy one call and sell a second one with a higher strike price and the same expiration date.
Here's an example:
-- Buy one GOOGL $262.50 call with an Oct. 31 expiration (i.e., after the earnings come out). This costs about $8.45 at recent prices.
-- Sell (write) one Oct. 31 GOOGL $282.50 call for roughly $2.30.
Net debit: $6.15
The options trader in this example is risking $6.15 to try to make $13.85, for a 225% maximum profit.
If said trader is also interested in taking on equity risk at a discount, the person could also add a put to the above trade. Example:
-- Sell (write) one Oct. 31 GOOGL $252.50 put for about $5.
This would reduce the trader's net debit to $1.15. While this greatly enhances the spread's potential profitability, the trader is exposed to possibly having to purchase 100 GOOGL shares at expiration at $253.65 net basis at a time when the stock would be trading below $252.50.
The maximum theoretical gain would increase to $18.85 x 100 (options multiplier) for a total of $1,885. The maximum theoretical loss would also increase substantially to $25,365, as although unlikely, the stock could potentially fall to zero.
(Moomoo Technologies Inc. Markets Commentator Stephen "Sarge" Guilfoyle was long GOOGL at the time of writing this column.)
This article discusses technical analysis, other approaches, including fundamental analysis, may offer very different views. The examples provided are for illustrative purposes only and are not intended to be reflective of the results you can expect to achieve. Specific security charts used are for illustrative purposes only and are not a recommendation, offer to sell, or a solicitation of an offer to buy any security. Past investment performance does not indicate or guarantee future success. Returns will vary, and all investments carry risks, including loss of principal. This content is also not a research report and is not intended to serve as the basis for any investment decision. The information contained in this article does not purport to be a complete description of the securities, markets, or developments referred to in this material. Moomoo and its affiliates make no representation or warranty as to the article's adequacy, completeness, accuracy or timeliness for any particular purpose of the above content. Furthermore, there is no guarantee that any statements, estimates, price targets, opinions or forecasts provided herein will prove to be correct.
Options trading is risky and not appropriate for everyone. Read the Options Disclosure Document (https://j.moomoo.com/017y9J) before trading. Options are complex and you may quickly lose the entire investment. Supporting docs for any claims will be furnished upon request.
Options trading subject to eligibility requirements. Strategies available will depend on options level approved.
Maximum potential loss and profit for options are calculated based on the single leg or an entire multi-leg trade remaining intact until expiration with no option contracts being exercised or assigned. These figures do not account for a portion of a multi-leg strategy being changed or removed or the trader assuming a short or long position in the underlying stock at or before expiration. Therefore, it is possible to lose more than the theoretical max loss of a strategy.
Moomoo is a financial information and trading app offered by Moomoo Technologies Inc. In the U.S., investment products and services on Moomoo are offered by Moomoo Financial Inc., Member FINRA/SIPC.
TradingView is an independent third party not affiliated with Moomoo Financial Inc., Moomoo Technologies Inc., or its affiliates. Moomoo Financial Inc. and its affiliates do not endorse, represent or warrant the completeness and accuracy of the data and information available on the TradingView platform and are not responsible for any services provided by the third-party platform.
Disclaimer
The information and publications are not meant to be, and do not constitute, financial, investment, trading, or other types of advice or recommendations supplied or endorsed by TradingView. Read more in the Terms of Use.
Disclaimer
The information and publications are not meant to be, and do not constitute, financial, investment, trading, or other types of advice or recommendations supplied or endorsed by TradingView. Read more in the Terms of Use.