This long-term chart captures
Completed Waves
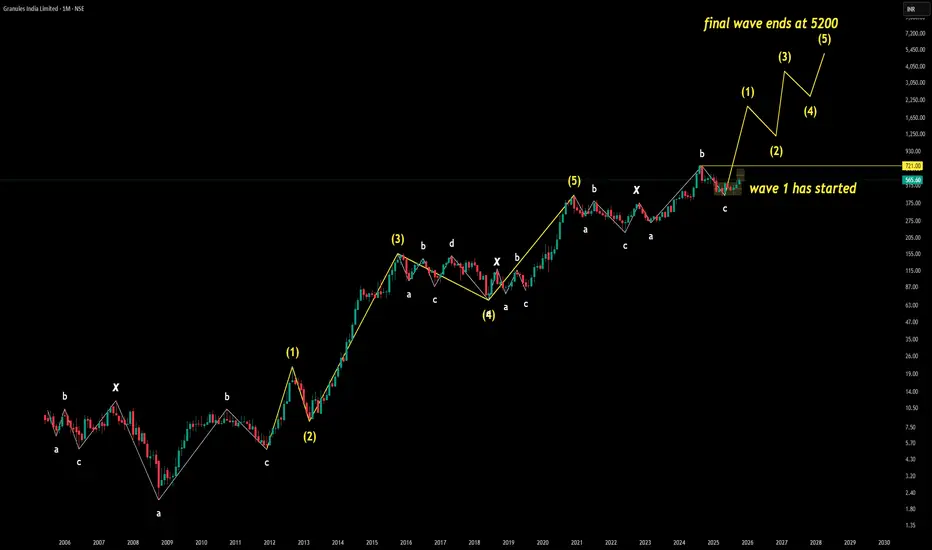
Impulse Waves: (1) → (5)
Corrective Waves: A → B → C
Complex correction: W → X → Y → X → Z
Structure confirms multi-decade wave symmetry and consolidation behavior
Current Setup
Wave 1 of the next major cycle has started
Final wave projection ends at 5200
Analyst Learning Takeaways
Complex corrections (W–X–Y–X–Z) often precede strong impulsive moves
Wave 1 initiation after prolonged correction signals trend reversal
Final wave targets are often derived from prior impulse symmetry and Fibonacci extensions
Analyst View The asset has completed a multi-decade corrective structure, including a rare W–X–Y–X–Z pattern, which typically marks the end of a prolonged consolidation phase. The initiation of Wave 1 suggests a fresh impulsive cycle is underway. Based on historical symmetry and proportional wave logic, the final wave is projected to end near 5200. This projection assumes Wave 2 will form a healthy base without breaching the origin of Wave 1. Traders should monitor early Wave 2 behavior for confirmation of cycle strength. If Wave 1 sustains momentum and Wave 2 holds structurally, the path to 5200 becomes technically viable.
Completed Waves
Impulse Waves: (1) → (5)
Corrective Waves: A → B → C
Complex correction: W → X → Y → X → Z
Structure confirms multi-decade wave symmetry and consolidation behavior
Current Setup
Wave 1 of the next major cycle has started
Final wave projection ends at 5200
Analyst Learning Takeaways
Complex corrections (W–X–Y–X–Z) often precede strong impulsive moves
Wave 1 initiation after prolonged correction signals trend reversal
Final wave targets are often derived from prior impulse symmetry and Fibonacci extensions
Analyst View The asset has completed a multi-decade corrective structure, including a rare W–X–Y–X–Z pattern, which typically marks the end of a prolonged consolidation phase. The initiation of Wave 1 suggests a fresh impulsive cycle is underway. Based on historical symmetry and proportional wave logic, the final wave is projected to end near 5200. This projection assumes Wave 2 will form a healthy base without breaching the origin of Wave 1. Traders should monitor early Wave 2 behavior for confirmation of cycle strength. If Wave 1 sustains momentum and Wave 2 holds structurally, the path to 5200 becomes technically viable.
Sucrit Patil
Disclaimer
The information and publications are not meant to be, and do not constitute, financial, investment, trading, or other types of advice or recommendations supplied or endorsed by TradingView. Read more in the Terms of Use.
Sucrit Patil
Disclaimer
The information and publications are not meant to be, and do not constitute, financial, investment, trading, or other types of advice or recommendations supplied or endorsed by TradingView. Read more in the Terms of Use.