Havells India Ltd. is currently showing a classic bullish technical setup—a Bullish Flag Pattern—that could lead to a potential breakout and strong upside movement in the short term. Traders who favor breakout-based strategies should pay close attention to this chart, especially considering the structured parallel channel and previous rally that preceded it.
1. Bullish Flag Pattern: Anatomy of the Setup
A bull flag is a continuation pattern that occurs after a sharp price rise (flagpole), followed by a period of consolidation within a narrow parallel channel (the flag). This structure typically suggests that the bullish trend will resume once the price breaks out of the flag range.
In Havells:
2. Breakout Levels and Price Action Confirmation
As per the current chart:
3. Projected Targets from the Pattern
4. Ideal Trading Plan (For Traders)
Entry:
After confirmed breakout above ₹1610
Or on retest near ₹1600–1610 zone with bullish price action.
Stop Loss:
Below the flag support zone at around ₹1570
Aggressive traders can keep it below ₹1585.
Targets:
T1: ₹1630
T2: ₹1680+
Risk-Reward Ratio:
Minimum 1:2 depending on entry price.
5. Risk Scenarios to Watch For
Conclusion: Havells Looks Set for a Fresh Rally
This is a textbook bullish flag breakout in formation, with clear upside potential. If the momentum sustains, Havells could very well reach 1680+ in the coming sessions. However, traders must practice disciplined risk management, wait for confirmation, and avoid chasing without a proper plan.
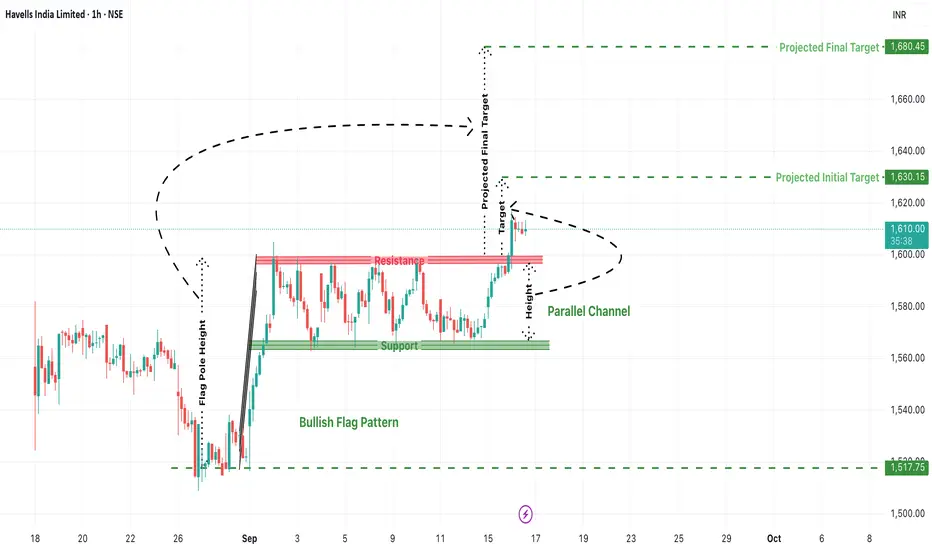
1. Bullish Flag Pattern: Anatomy of the Setup
A bull flag is a continuation pattern that occurs after a sharp price rise (flagpole), followed by a period of consolidation within a narrow parallel channel (the flag). This structure typically suggests that the bullish trend will resume once the price breaks out of the flag range.
In Havells:
- Flag Pole: The stock surged sharply from the 1517 zone to near 1610, forming a vertical rise.
- Flag/Channel: Price moved sideways within a narrow support at ~1570 and resistance at ~1610, creating a clean parallel channel.
- This shows price compression after a strong move, typically a sign of healthy consolidation before another leg up.
2. Breakout Levels and Price Action Confirmation
As per the current chart:
- Havells has broken above the resistance zone around 1610, signaling a potential breakout.
- The breakout candle is attempting to close above the red resistance band, and follow-up candles will be crucial to confirm strength.
- A retest of this breakout zone could offer ideal long entries.
3. Projected Targets from the Pattern
- Using the flagpole height, we can project upside targets from the breakout point:
- Initial Target: ₹1630.15
- A conservative target based on minor resistance and pole extension.
- Final Projected Target: ₹1680.45
- This marks the full measured move and could be achieved if the rally sustains momentum.
4. Ideal Trading Plan (For Traders)
Entry:
After confirmed breakout above ₹1610
Or on retest near ₹1600–1610 zone with bullish price action.
Stop Loss:
Below the flag support zone at around ₹1570
Aggressive traders can keep it below ₹1585.
Targets:
T1: ₹1630
T2: ₹1680+
Risk-Reward Ratio:
Minimum 1:2 depending on entry price.
5. Risk Scenarios to Watch For
- False Breakouts: If the breakout doesn’t sustain and price falls back into the channel, it may trap early longs.
- Macro Events: Broader market volatility (Nifty moves or global cues) can impact momentum.
- Volume: Lack of volume on breakout candles can reduce conviction—always monitor volume to confirm strength.
Conclusion: Havells Looks Set for a Fresh Rally
This is a textbook bullish flag breakout in formation, with clear upside potential. If the momentum sustains, Havells could very well reach 1680+ in the coming sessions. However, traders must practice disciplined risk management, wait for confirmation, and avoid chasing without a proper plan.
📈 Trade Smarter with TradZoo!
📣 Telegram: t.me/tradzooIndex
📣 Forex Telegram: t.me/tradzoofx
📲 Mobile App: tradzoo.com/download
📲 Forex App:tradzoo.com/forex/download
🔗 Website: bit.ly/tradzoopage
📣 Telegram: t.me/tradzooIndex
📣 Forex Telegram: t.me/tradzoofx
📲 Mobile App: tradzoo.com/download
📲 Forex App:tradzoo.com/forex/download
🔗 Website: bit.ly/tradzoopage
Disclaimer
The information and publications are not meant to be, and do not constitute, financial, investment, trading, or other types of advice or recommendations supplied or endorsed by TradingView. Read more in the Terms of Use.