HBARUSDT 1H Chart Analysis | Bullish Structure in Play
🔍 Let’s break down the recent price action for the HBAR/USDT perpetual contract and outline the roadmap for potential bullish continuation.
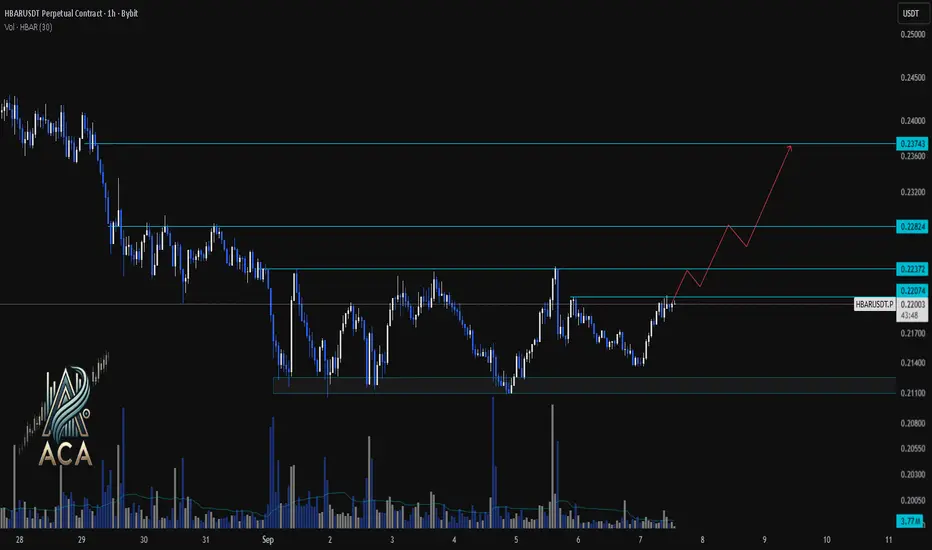
⏳ 1-Hour Overview
The 1-hour chart shows HBAR recovering from a strong demand zone near $0.21100, pushing upward with notable momentum. Price action is now challenging immediate resistance at $0.22372, with higher levels at $0.22824 and $0.23743 presenting the next bullish targets.
🔺 Long Setup:
A decisive close and hold above $0.22372 could fuel further upside, targeting the $0.22824 resistance next. Sustained bullish volume and higher lows may pave the way for an extension up to $0.23743, aligning with the drawn projection path.
📊 Key Highlights:
- Strong defense of the $0.21100 support region led to a sharp rebound.
- Immediate resistance stands at $0.22372, with the bullish path mapped toward $0.22824 and $0.23743.
- Volume spikes on upward candles indicate increasing buyer interest and potential for trend follow-through.
🚨 Conclusion:
HBARUSDT is building a bullish structure above local support, with momentum favoring continued upside if $0.22372 flips into support. Watching volume and reaction at key resistance areas remains crucial for confirming the next leg higher.
🔍 Let’s break down the recent price action for the HBAR/USDT perpetual contract and outline the roadmap for potential bullish continuation.
⏳ 1-Hour Overview
The 1-hour chart shows HBAR recovering from a strong demand zone near $0.21100, pushing upward with notable momentum. Price action is now challenging immediate resistance at $0.22372, with higher levels at $0.22824 and $0.23743 presenting the next bullish targets.
🔺 Long Setup:
A decisive close and hold above $0.22372 could fuel further upside, targeting the $0.22824 resistance next. Sustained bullish volume and higher lows may pave the way for an extension up to $0.23743, aligning with the drawn projection path.
📊 Key Highlights:
- Strong defense of the $0.21100 support region led to a sharp rebound.
- Immediate resistance stands at $0.22372, with the bullish path mapped toward $0.22824 and $0.23743.
- Volume spikes on upward candles indicate increasing buyer interest and potential for trend follow-through.
🚨 Conclusion:
HBARUSDT is building a bullish structure above local support, with momentum favoring continued upside if $0.22372 flips into support. Watching volume and reaction at key resistance areas remains crucial for confirming the next leg higher.
Disclaimer
The information and publications are not meant to be, and do not constitute, financial, investment, trading, or other types of advice or recommendations supplied or endorsed by TradingView. Read more in the Terms of Use.
Disclaimer
The information and publications are not meant to be, and do not constitute, financial, investment, trading, or other types of advice or recommendations supplied or endorsed by TradingView. Read more in the Terms of Use.