The technical structure for  HIMS is aligning to form a compelling bullish narrative, suggesting the prolonged downtrend may be concluding and a significant new upward cycle could be beginning. The convergence of a key reversal level, a classic continuation pattern, and strong momentum indicators warrants close attention.
1. The Macro View: A Potential Bottom Formation
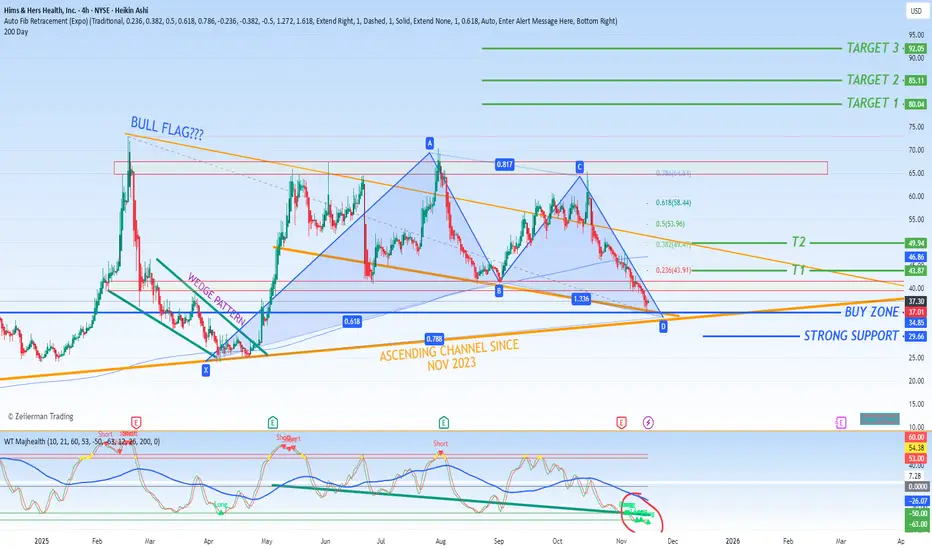
Your previous identification of the $35.00 level as a potential bottom appears increasingly prescient. This price level has acted as a formidable support floor, repelling multiple bearish attempts to drive the price lower. The ability to hold this level is the first and most critical step in establishing a new bullish trend. It indicates that selling pressure has been exhausted at this valuation and buyers are consistently stepping in, building a solid foundation for a potential recovery.
2. The Pattern: A Promising Bull Flag Consolidation
Currently, the price action is shaping into what technical analysts recognize as a Bull Flag pattern. This pattern typically forms after a sharp upward move (the flagpole) and is characterized by a slight, downward-sloping consolidation channel (the flag).
Interpretation: This pattern is not a sign of weakness, but rather a period of healthy consolidation. It indicates that the market is pausing to digest the initial gains from the bounce off the $35.00 low, shaking out weak hands, and preparing for the next leg up. A decisive breakout above the upper trendline of this flag would be the confirmation that the next phase of the bull run has commenced.
3. Momentum Confirmation: Indicator Alignment
Adding significant weight to the bullish structure is the signal from your momentum indicators. The MACD (Moving Average Convergence Divergence) is showing a very strong buy signal. This typically manifests as a bullish crossover and a rising histogram, indicating that underlying short-term momentum is accelerating and supporting the thesis of a trend change. This alignment between price pattern and momentum oscillator significantly strengthens the overall bullish conviction.
4. Strategic Trade Setup: Zones for Entry, Exit, and Risk
For Swing Traders:
Profit-Taking Targets: Based on Fibonacci retracement levels of the prior major downtrend, logical areas to secure profits are:
Primary Target: $43.91 (0.236 Fib). This is the initial resistance level and a logical zone for the first wave of profit-taking.
Secondary Target: $49.47 (0.382 Fib). A break above the first target opens the path to this more significant resistance level, which often acts as a key test in a new bull trend.
Risk Management & Entry Strategy:
Buy Zone & Primary Support: The current levels within the bull flag pattern, and specifically the $35.00 zone, represent the primary buy zone and critical support. This is the level that must hold to keep the bullish thesis intact.
Secondary Support: As you astutely noted, a valid second support level exists slightly below the flag. A pullback to this level that finds a bounce would present a high-probability secondary entry opportunity, offering a better risk-reward profile. A breakdown through this secondary support, however, would force a re-evaluation of the short-term bullish outlook.
Conclusion: A Call for Patience and Discipline
The setup forHIMS is indeed promising. The potential double-bottom at $35.00, the developing bull flag, and the strong MACD buy signal collectively paint a compelling picture for a sustained bull run.
The key now, as you rightly stated, is patience. We must allow the market to confirm this setup by providing a decisive breakout above the flag's resistance. Until then, the strategy is to respect the defined support levels, manage risk accordingly, and be prepared to act when the market gives its final confirmation.
1. The Macro View: A Potential Bottom Formation
Your previous identification of the $35.00 level as a potential bottom appears increasingly prescient. This price level has acted as a formidable support floor, repelling multiple bearish attempts to drive the price lower. The ability to hold this level is the first and most critical step in establishing a new bullish trend. It indicates that selling pressure has been exhausted at this valuation and buyers are consistently stepping in, building a solid foundation for a potential recovery.
2. The Pattern: A Promising Bull Flag Consolidation
Currently, the price action is shaping into what technical analysts recognize as a Bull Flag pattern. This pattern typically forms after a sharp upward move (the flagpole) and is characterized by a slight, downward-sloping consolidation channel (the flag).
Interpretation: This pattern is not a sign of weakness, but rather a period of healthy consolidation. It indicates that the market is pausing to digest the initial gains from the bounce off the $35.00 low, shaking out weak hands, and preparing for the next leg up. A decisive breakout above the upper trendline of this flag would be the confirmation that the next phase of the bull run has commenced.
3. Momentum Confirmation: Indicator Alignment
Adding significant weight to the bullish structure is the signal from your momentum indicators. The MACD (Moving Average Convergence Divergence) is showing a very strong buy signal. This typically manifests as a bullish crossover and a rising histogram, indicating that underlying short-term momentum is accelerating and supporting the thesis of a trend change. This alignment between price pattern and momentum oscillator significantly strengthens the overall bullish conviction.
4. Strategic Trade Setup: Zones for Entry, Exit, and Risk
For Swing Traders:
Profit-Taking Targets: Based on Fibonacci retracement levels of the prior major downtrend, logical areas to secure profits are:
Primary Target: $43.91 (0.236 Fib). This is the initial resistance level and a logical zone for the first wave of profit-taking.
Secondary Target: $49.47 (0.382 Fib). A break above the first target opens the path to this more significant resistance level, which often acts as a key test in a new bull trend.
Risk Management & Entry Strategy:
Buy Zone & Primary Support: The current levels within the bull flag pattern, and specifically the $35.00 zone, represent the primary buy zone and critical support. This is the level that must hold to keep the bullish thesis intact.
Secondary Support: As you astutely noted, a valid second support level exists slightly below the flag. A pullback to this level that finds a bounce would present a high-probability secondary entry opportunity, offering a better risk-reward profile. A breakdown through this secondary support, however, would force a re-evaluation of the short-term bullish outlook.
Conclusion: A Call for Patience and Discipline
The setup for
The key now, as you rightly stated, is patience. We must allow the market to confirm this setup by providing a decisive breakout above the flag's resistance. Until then, the strategy is to respect the defined support levels, manage risk accordingly, and be prepared to act when the market gives its final confirmation.
Disclaimer
The information and publications are not meant to be, and do not constitute, financial, investment, trading, or other types of advice or recommendations supplied or endorsed by TradingView. Read more in the Terms of Use.
Disclaimer
The information and publications are not meant to be, and do not constitute, financial, investment, trading, or other types of advice or recommendations supplied or endorsed by TradingView. Read more in the Terms of Use.