Chart Breakdown
1. Price Action & Trend
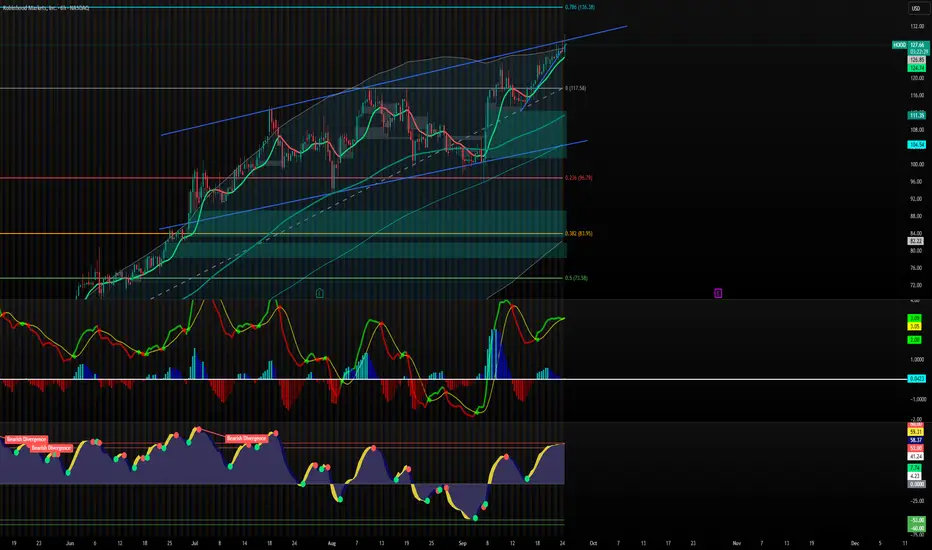
Current price: ~128.19
The stock is moving inside a rising wedge channel (two converging upward blue lines).
Price is testing the upper resistance of the wedge — often a spot where momentum can stall or reverse.
Strong uptrend since late August, but this steep climb may be overextended.
2. Fibonacci Levels
Major retracement levels marked:
0.236 (~96.79) = First key support if price pulls back.
0.382 (~83.95) = Deeper support zone.
0.786 (~136.38) = Next potential target/resistance above.
The price is approaching the 0.786 Fib target at ~136, which could act as a ceiling.
3. Indicators
MACD (middle panel): Positive momentum, but the histogram shows it’s starting to flatten. It could mean slowing momentum.
Oscillator (bottom panel):
Shows previous bearish divergences (price made higher highs, oscillator didn’t).
Currently in the overbought zone.
Signals potential for a pullback soon.
4. Volume / Strength
The recent move up came with strong buying volume (supporting the rally).
But rising wedge patterns usually break downward once buyers are exhausted.
📊 Sentiment & Prediction
Short-Term Sentiment:
🔼 Bullish momentum (trend is still up, targeting ~136).
⚠️ But overbought indicators + wedge resistance suggest caution.
Medium-Term Sentiment:
If HOOD fails to break above 130–136 resistance, a retracement toward 117 support (channel midline) or even 96–100 (Fib 0.236) is possible.
Long-Term Sentiment:
Still overall bullish trend intact unless price breaks below the wedge support (~117 → 96 zone).
✅ Summary:
Bullish but overextended.
Watch for rejection near 130–136 → could trigger a pullback.
Key support levels = 117, 96, 84.
Break above 136 with volume = strong bullish continuation.
1. Price Action & Trend
Current price: ~128.19
The stock is moving inside a rising wedge channel (two converging upward blue lines).
Price is testing the upper resistance of the wedge — often a spot where momentum can stall or reverse.
Strong uptrend since late August, but this steep climb may be overextended.
2. Fibonacci Levels
Major retracement levels marked:
0.236 (~96.79) = First key support if price pulls back.
0.382 (~83.95) = Deeper support zone.
0.786 (~136.38) = Next potential target/resistance above.
The price is approaching the 0.786 Fib target at ~136, which could act as a ceiling.
3. Indicators
MACD (middle panel): Positive momentum, but the histogram shows it’s starting to flatten. It could mean slowing momentum.
Oscillator (bottom panel):
Shows previous bearish divergences (price made higher highs, oscillator didn’t).
Currently in the overbought zone.
Signals potential for a pullback soon.
4. Volume / Strength
The recent move up came with strong buying volume (supporting the rally).
But rising wedge patterns usually break downward once buyers are exhausted.
📊 Sentiment & Prediction
Short-Term Sentiment:
🔼 Bullish momentum (trend is still up, targeting ~136).
⚠️ But overbought indicators + wedge resistance suggest caution.
Medium-Term Sentiment:
If HOOD fails to break above 130–136 resistance, a retracement toward 117 support (channel midline) or even 96–100 (Fib 0.236) is possible.
Long-Term Sentiment:
Still overall bullish trend intact unless price breaks below the wedge support (~117 → 96 zone).
✅ Summary:
Bullish but overextended.
Watch for rejection near 130–136 → could trigger a pullback.
Key support levels = 117, 96, 84.
Break above 136 with volume = strong bullish continuation.
Disclaimer
The information and publications are not meant to be, and do not constitute, financial, investment, trading, or other types of advice or recommendations supplied or endorsed by TradingView. Read more in the Terms of Use.
Disclaimer
The information and publications are not meant to be, and do not constitute, financial, investment, trading, or other types of advice or recommendations supplied or endorsed by TradingView. Read more in the Terms of Use.