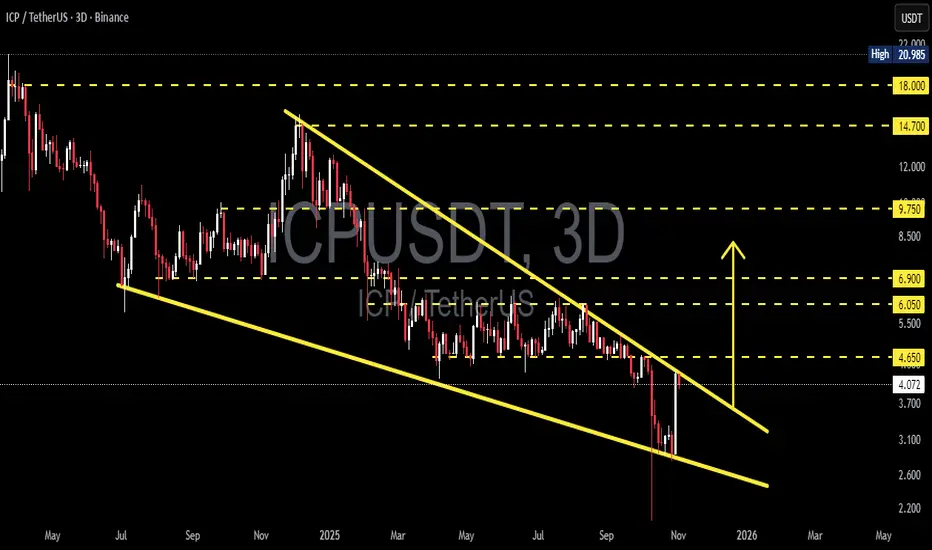
The ICP/USDT chart is currently displaying a highly critical structure as price continues to compress within a Falling Wedge pattern that has been developing since early 2025.
This formation is often seen as a bullish reversal signal — typically marking the end of a prolonged downtrend and the start of an accumulation or reversal phase.
At the current price level around $4.09, selling pressure has started to weaken, while buying pressure is gradually building up. Price is reacting positively from the lower wedge boundary and is now challenging the upper trendline resistance.
A confirmed breakout above this zone, especially with strong volume, could spark a major bullish momentum — opening the door for a move toward the next resistance targets at $4.65, $6.05, and $6.90.
However, if the price faces rejection once again from the upper wedge boundary, consolidation or another retest of the $3.10–$2.60 support zone remains possible.
This area marks a decisive moment for ICP’s mid-term direction.
---
Pattern Description
A clear Falling Wedge (Bullish Reversal Pattern) is visible through two downward-sloping and converging trendlines.
Key characteristics: lower lows are slowing down, highs continue to descend, and trading volume decreases over time.
Technical implication: selling pressure is fading, and accumulation is likely occurring before a potential reversal.
---
Bullish Scenario
A confirmed bullish breakout would occur once the price closes decisively above the upper wedge line and the $4.65 resistance on the 3-day timeframe, accompanied by a surge in trading volume.
If validated, upside targets could include:
Target 1: $6.05 (initial resistance and profit-taking area)
Target 2: $6.90 (mid-range wedge resistance)
Target 3: $9.75 (major resistance zone and possible momentum expansion)**
Breakouts from large falling wedges on higher timeframes often trigger strong mid- to long-term reversals, particularly when supported by high volume.
---
Bearish Scenario
If the breakout attempt fails and price gets rejected around the $4.65–$4.80 region, selling pressure could drag ICP back down toward the $3.10 – $2.60 support zone.
A breakdown below this area would invalidate the bullish setup and likely resume the macro bearish trend.
The $3.10 level is the key structural support — losing it would confirm renewed weakness.
---
Overall Outlook
ICP is currently at a make-or-break level, where a confirmed breakout could shift market sentiment from bearish to neutral–bullish.
The technical structure favors a potential trend reversal, but confirmation is crucial before positioning aggressively.
False breakouts remain possible, so risk management and patience are essential.
Psychologically, reclaiming $4.65 would be the first sign of a sentiment shift, potentially leading to renewed investor confidence in ICP’s mid-term recovery.
---
Summary
Pattern: Falling Wedge (Bullish Reversal Pattern)
Status: Approaching breakout area
Bullish Trigger Zone: Above $4.65
Bullish Targets: $6.05 → $6.90 → $9.75
Critical Support Zone: $3.10 – $2.60
Dominant Bias: Neutral turning bullish upon breakout confirmation
---
#ICP #ICPUSDT #ICPTether #CryptoAnalysis #TechnicalAnalysis #FallingWedge #ReversalPattern #BreakoutSetup #SwingTrade #CryptoChart #AltcoinWatch #MarketStructure
✅ Get Free Signals! Join Our Telegram Channel Here: t.me/TheCryptoNuclear
✅ Twitter: twitter.com/crypto_nuclear
✅ Join Bybit : partner.bybit.com/b/nuclearvip
✅ Benefits : Lifetime Trading Fee Discount -50%
✅ Twitter: twitter.com/crypto_nuclear
✅ Join Bybit : partner.bybit.com/b/nuclearvip
✅ Benefits : Lifetime Trading Fee Discount -50%
Disclaimer
The information and publications are not meant to be, and do not constitute, financial, investment, trading, or other types of advice or recommendations supplied or endorsed by TradingView. Read more in the Terms of Use.