📊 Daily Support & Resistance Levels
Support Levels:
S1: ₹91.43
S2: ₹90.93
S3: ₹90.14
S4: ₹88.93
Resistance Levels:
R1: ₹92.14
R2: ₹92.93
R3: ₹94.14
R4: ₹94.93
These levels are derived from standard pivot point calculations and serve as potential zones where price action may encounter support or resistance.
🔍 Current Price Action
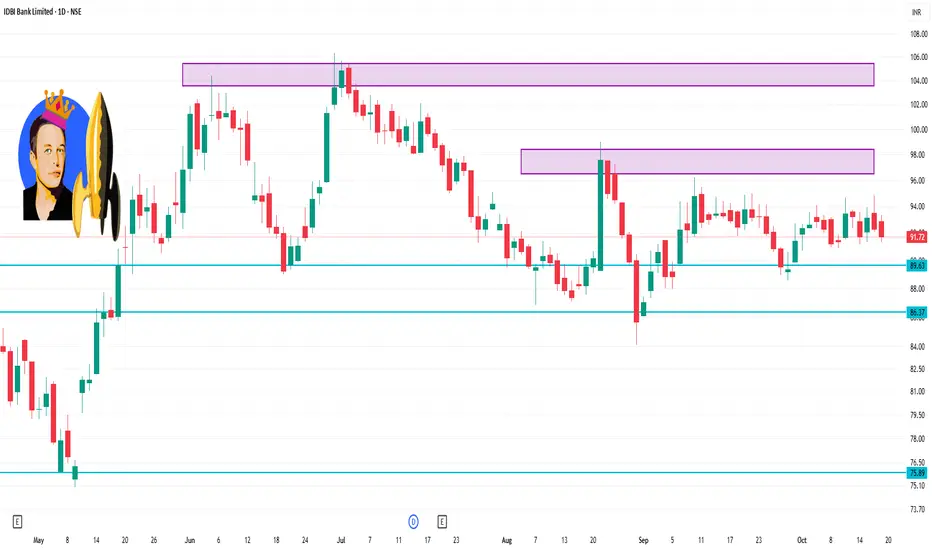
Last Traded Price: ₹91.72 (as of October 17, 2025)
Recent Trend: The stock has been trading below the pivot point of ₹92.80, indicating a bearish short-term trend.
Key Levels to Watch:
Immediate Support: ₹91.69 (S1)
Immediate Resistance: ₹94.25 (R1)
Breakout Point: A move above ₹94.25 could signal a potential reversal to the upside.
Support Levels:
S1: ₹91.43
S2: ₹90.93
S3: ₹90.14
S4: ₹88.93
Resistance Levels:
R1: ₹92.14
R2: ₹92.93
R3: ₹94.14
R4: ₹94.93
These levels are derived from standard pivot point calculations and serve as potential zones where price action may encounter support or resistance.
🔍 Current Price Action
Last Traded Price: ₹91.72 (as of October 17, 2025)
Recent Trend: The stock has been trading below the pivot point of ₹92.80, indicating a bearish short-term trend.
Key Levels to Watch:
Immediate Support: ₹91.69 (S1)
Immediate Resistance: ₹94.25 (R1)
Breakout Point: A move above ₹94.25 could signal a potential reversal to the upside.
Related publications
Disclaimer
The information and publications are not meant to be, and do not constitute, financial, investment, trading, or other types of advice or recommendations supplied or endorsed by TradingView. Read more in the Terms of Use.
Related publications
Disclaimer
The information and publications are not meant to be, and do not constitute, financial, investment, trading, or other types of advice or recommendations supplied or endorsed by TradingView. Read more in the Terms of Use.