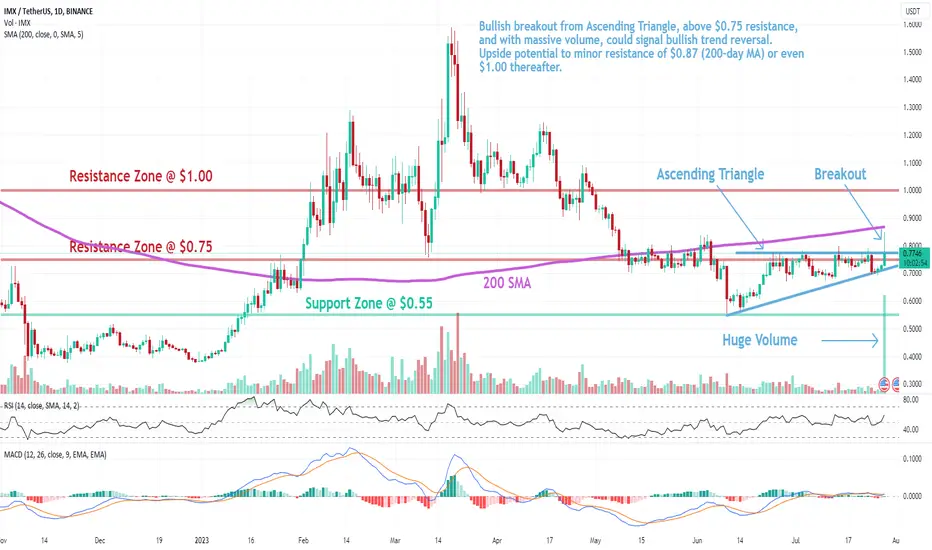
Trade setup: Bullish breakout from Ascending Triangle, above $0.75 resistance, and with massive volume, could signal bullish trend reversal. Upside potential to minor resistance of $0.87 (200-day MA) or even $1.00 thereafter.
Pattern: Ascending Triangle which is a continuation pattern (it typically breaks out in the direction of existing trend). Most traders wait for a breakout but Swing traders could trade between the trendlines (Buy at Support, Sell at Resistance) as long as the trendlines are still relatively far apart.
Trend: Neutral on Medium-Term basis and Downtrend on Short- and Long-Term basis.
Momentum is Bullish (MACD Line is above MACD Signal Line and RSI is above 55).
Support and Resistance: Nearest Support Zone is $0.55. The nearest Resistance Zone is $0.75, which it broke, then $1.00, and $1.30.
Disclaimer
The information and publications are not meant to be, and do not constitute, financial, investment, trading, or other types of advice or recommendations supplied or endorsed by TradingView. Read more in the Terms of Use.
Disclaimer
The information and publications are not meant to be, and do not constitute, financial, investment, trading, or other types of advice or recommendations supplied or endorsed by TradingView. Read more in the Terms of Use.