📌 Latest Price Snapshot & Context
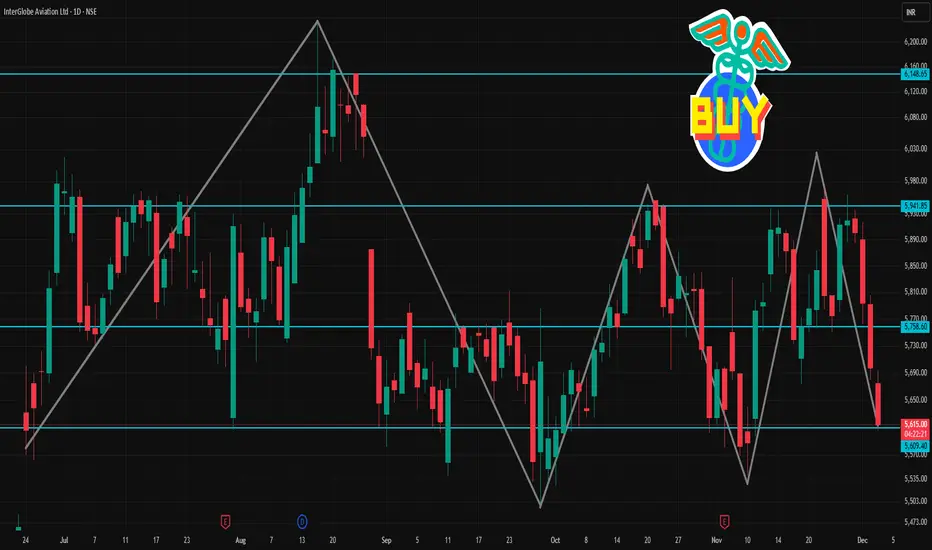
On a recent trading day, the stock’s day’s range was ~ ₹ 5,626 – ₹ 5,694.
The 52-week range remains ₹ 3,945 – ₹ 6,232.50.
Recent closing / quoted prices have been around ₹ 5,900 – ₹ 5,913 (though there are multiple sources — price may fluctuate intraday).
🔄 Daily Pivot & Key Intraday Levels (Standard + Camarilla/Fibonacci from a common pivot-level table)
From a recent pivot-level analysis for “daily” timeframe:
Level Type / Label Price (Approx, ₹)
Pivot (standard daily) ₹ 5,672.33
Support 1 (S1) ₹ 5,634.67
Support 2 (S2) ₹ 5,599.33
Support 3 (S3) ₹ 5,561.67
Resistance 1 (R1) ₹ 5,707.67
Resistance 2 (R2) ₹ 5,745.33
Resistance 3 (R3) ₹ 5,780.67
For “Camarilla” variant on same day: pivot also ₹ 5,672.33, with S- and R- levels slightly tighter: e.g. S1 around ₹ 5,663, R1 around ₹ 5,677.
Some alternate analyses cite supports around ₹ 5,733 / ₹ 5,671 / ~₹ 5,579, and resistances ~ ₹ 5,804 / ₹ 5,832 / ~₹ 5,978 depending on timeframe/ method.
Related publications
Disclaimer
The information and publications are not meant to be, and do not constitute, financial, investment, trading, or other types of advice or recommendations supplied or endorsed by TradingView. Read more in the Terms of Use.
Related publications
Disclaimer
The information and publications are not meant to be, and do not constitute, financial, investment, trading, or other types of advice or recommendations supplied or endorsed by TradingView. Read more in the Terms of Use.