XAGUSD – Weekly Bearish Structure | Key Support ZonesSilver continues to show bearish characteristics on the weekly timeframe, with lower highs, lower lows, and price moving within a descending channel.
The recent break of structure reinforces the current bearish interpretation. Price is now approaching the 47–50 reaction area, which deserves attention as the market develops its next move.
Key Technical Areas
47–50: Current reaction area; demand is not yet confirmed.
55–60: Potential bearish order block and retest resistance.
64–70: Higher-ti
Chartpatternstrading
EUR/USD: SMC Breakdown & Key Chart Patterns RevealedFollowing the recent rejection near the upper supply resistance boundaries and the descending wedge pattern, EUR/USD formed a structured reaction within the lower demand zone, signaling an important test of macro market structure. Price has since respected immediate structural support near the 1.12626 level, aligning with incoming volatility drivers.
Hello Community,
Welcome to my new analysis of EUR/USD from a daily chart and structural liquidity perspective. In my recent tracking sequence, I
GBPCAD 4H Analysis | Potential LONG Setup
GBPCAD has bounced off an important support level dating back to September 2025. Following a CHoCH, price has rebounded from the FVG. Wait for a confirmed BoS before considering a LONG entry. Look for MACD and RSI confluence to strengthen the setup.
#GBPCAD #ForexTrading #ForexAnalysis #PriceAction #MarketStructure #CHoCH #BoS #FVG #MACD #RSI
BTC: Back After 4 Years. Testing the 1D Bullish OBHi everyone!
It's been almost 4 years since my last idea here, and a lot has changed since then.
Bitcoin is now sitting in a key zone, testing a bullish 1D order block. The macro picture is still bullish, and I see room for a move toward 90k–93k.
Main thing I'm watching: a sweep of the 87.4k high.
For further longs, I'd like to see a bullish structure form first, with price holding and consolidating above 78.8k. Without that, I'm in no rush to add.
Not financial advice. Manage your risk.
$ZEC: Situation breakdown. What's next?BYBIT:ZECUSDT.P
Expected BTC correction triggered a massive altcoin dump. CRYPTOCAP:ZEC showing just as sharp a pullback after its explosive run.
🧩IMA shows 🐋large players exiting the asset: reducing positions and spot outflow.
Nearest major monthly support 📊M-Levels sits in $1.221–$1.269 range, where we can already look for entry on reversal confirmation.
Also don't rule out a retest of monthly resistance 📊M-Levels $1.405–$1.457 before further downside, where short can be considered. But si
#LTCUSDT Sell Trade Scenario.📉 LTCUSDT SELL Scenario 📉
🔥 A strong selling opportunity for LTCUSDT!
Our analysis indicates potential bearish momentum, making this setup suitable for traders looking for a downside move.
🎯 Entry: Sell Zone
🛑 Stop Loss: Above Resistance
💰 Take Profit: Key Support Levels
JUBLFOOD: Adam & Eve Pattern Near a Key Breakout ZoneJUBLFOOD has been showing an interesting change in structure on the daily chart.
After falling toward the ₹405–₹410 area, the stock started recovering. The first bottom was sharp, while the second bottom developed more gradually around ₹410–₹425.
This creates a potential Adam & Eve double-bottom pattern.
The most important part of the setup is now the neckline.
The ₹495–₹500 Zone Matters
Price has climbed strongly back toward the ₹495–₹500 area, where the previous recovery attempt failed.
XAUUSD Correction Wave Toward 4h TargetXAUUSD (Gold/US Dollar)
Timeframe : 1-hour chart (1h)
Gold has been trading within a descending channel , showing a clear corrective structure after a strong bearish impulse. The current setup highlights a potential bullish correction forming from the lower boundary of the channel, supported by a 1-hour Order Block (OB) and Fibonacci confluence .
Market Structure: Price created a series of lower highs and lower lows, confirming the short-term bearish trend. The recent rejection fr
XAU/USD – Descending Channel Meets Strong Demand ZoneThe XAU/USD 30-minute chart is currently trading inside a broader corrective structure after completing a strong bearish move from the recent swing high. Price has reacted multiple times within a well-defined descending channel, confirming that sellers still have control over the short-term trend. However, the market is now approaching a significant demand region where buyers have previously stepped in aggressively.
The highlighted B-Gap Fair Value Gap (FVG) and the lower demand zone around the
Daily Consolidation at Key Fibonacci Support Zone [Educational]📊 Styrenix Performance Materials Ltd (STYRENIX) - Daily (1D) Chart Analysis
This post is shared for EDUCATIONAL PURPOSES ONLY to analyze daily Fibonacci structures and moving average setups. It is not financial or investment advice.
🟢 Technical Observations:
1. Reclaimed Support Floor: On the daily timeframe, STYRENIX has established strong baseline support at the 50.00% Fibonacci level (2,095.50).
2. Moving Average Crossover: The short-term moving averages (blue and red lines) have compresse
Meta Platforms:The story just changed; the chart is catching up?There has been a major shift at Meta Platforms Inc. and it was neither related to an earnings report nor to a product rollout. Rather, there has been an important strategic rebranding which will take time for the markets to value. On July 10, Meta announced the roll out of Meta Compute, along with the development of the Iris AI chip – a customized computer chip going into production this September and enabling plans to double their capacity of computing from 7 gigawatts by 2026 to 14 gigawatts b
SOMANYCERA: 4H Channel Breakout Consolidating for Next Macro Leg📊 Somany Ceramics Limited (SOMANYCERA) - 4-Hour (4H) Chart Analysis
This post is shared for EDUCATIONAL PURPOSES ONLY to analyze structural descending channel breakouts and immediate consolidation zones. It is not financial or investment advice.
🎯 Educational Swing Setup:
• Entry Zone: 510.00 – 539.35 (Accumulating blocks within this current horizontal base, or capitalizing on a confirmed close breakout above 548.00).
• Target 1: 600.00 (Near-term structural resistance and major psychological m
Testing Major Horizontal Resistance Shelf on the Daily 📊 Choice International Limited (CHOICEIN) - Daily (1D) Chart Analysis
This post is shared for EDUCATIONAL PURPOSES ONLY to observe horizontal key levels and potential breakout setups. It is not financial or investment advice.
🟢 Technical Observations:
1. Horizontal Resistance Test: On the daily timeframe, CHOICEIN is trading exactly at a critical horizontal resistance boundary between 726.00 and 730.00.
2. Moving Average Recovery: The price has successfully climbed back above its short-term a
RISHABH: Massive Weekly Multi-Month Horizontal Breakout 📊 Rishabh Instruments Limited (RISHABH) - Weekly (1W) Chart Analysis
This post is shared for EDUCATIONAL PURPOSES ONLY to analyze horizontal range breakouts and structural shifts on macro timeframes. It is not financial or investment advice.
🟢 Technical Observations:
1. Significant Horizontal Breakout: On the weekly chart, RISHABH has decisively smashed through a vital, multi-month horizontal resistance box established between 600.00 and 620.00.
2. Strong Weekly Close: The current weekly cand
OFSS: Volatility Coiling for an Imminent 1,938-Point Move!🔥 OFSS: Volatility Coiling for an Imminent 1,938-Point Move! 🚀
Oracle Financial Services Software Limited (OFSS) is currently trading at a critical decision point as price compresses into the apex of a well-defined Symmetrical Triangle. With volatility steadily contracting and structure tightening around Pivot D, the market appears to be storing energy for a directional move that could exceed 1,900 points.
________________________________________
📐 Pattern Structure: Symmetrical Triangle
The
APOLLO: Bullish Breakout and Momentum Continuation Setup 📊 Apollo Micro Systems Ltd. (APOLLO) - Daily Chart Breakdown
This post is for EDUCATIONAL PURPOSES ONLY and reflects my personal view on the price action. It is not financial or investment advice.
🟢 Technical Observations:
1. Structural Breakout: The price has successfully broken out of a consolidation range, clearing major resistance levels around 402.50 with strong volume support.
2. Moving Average Alignment: The stock is trading comfortably above its key short and medium-term moving average
Suzlon Energy (1D) – Descending Channel Breakout WatchSuzlon Energy (1D) – Descending Channel Breakout Watch
Suzlon appears to be trading within a long-term falling channel that has been in place since the 2024 peak near ₹85. After finding strong support around the lower trendline (~₹40), the stock has staged a sharp recovery and is now testing the upper boundary of the channel near ₹58–60.
Key Observations:
✅ Strong bounce from channel support.
✅ Higher lows forming over the last few months.
✅ Price is now challenging a major descending resistance
$GM Stock - bullish set up
NYSE:GM has broken out of a falling wedge pattern on the daily timeframe, a bullish technical signal that often precedes a strong upward move. The breakout suggests increasing buying momentum, with further upside expected in the coming sessions.
🎯 TP1: $87.62
🎯 TP2: $94.37
As long as the price holds above the breakout zone, the bullish outlook remains intact.
#GM #GeneralMotors #StockMarket #TechnicalAnalysis #BreakoutTrading #SwingTrading #Bullish #StocksToWatch #PriceAction #TradingIdea
$AMT Stock - Falling Wedge Pattern
NYSE:AMT has successfully broken out of a falling wedge chart pattern on the daily (1D) timeframe, a bullish technical setup that often signals a potential trend reversal and continuation to the upside.
The breakout is supported by an improved price structure, indicating that buyers are regaining control after an extended period of consolidation. As long as the breakout level holds, the stock could continue its upward momentum toward the next key resistance zones.
Profit Targets:
Target 1:
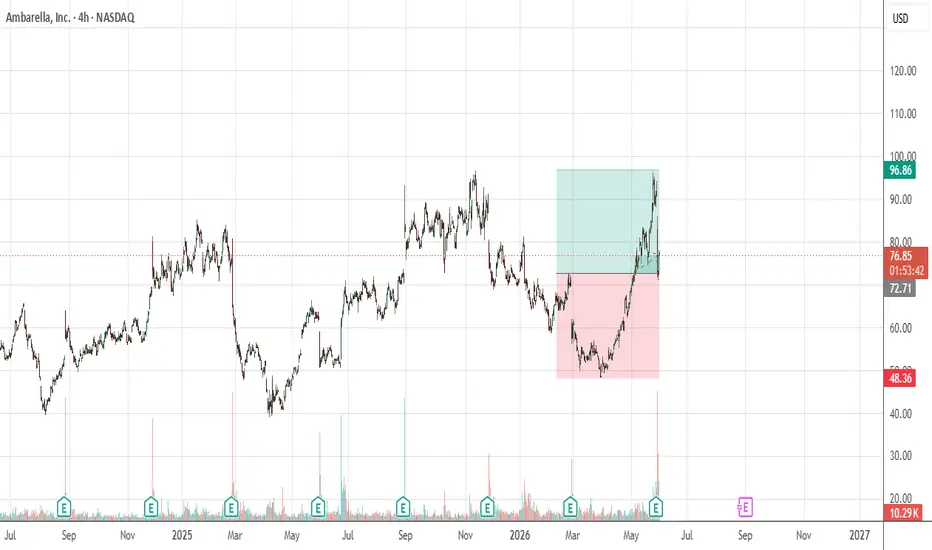
AMBA: Bullish Setup & Long-term View (Shariah Compliant)AMBA: Bullish Setup for Ambarella Inc. (Shariah-Compliant)
📈 Technical Analysis (4H Chart):
The chart indicates a solid accumulation phase and a potential bullish reversal. We are looking at a long-term position with a well-defined risk-to-reward ratio.
📊 Trade Parameters:
• Entry Zone: Around $72.18 - $72.43
• Target Price: $96.86 (+33.7% potential upside)
• Stop Loss: $48.36
🕋 Shariah Status:
• Verified Halal and Shariah-compliant according to Islamic stock screening methodologies.
⚠️ Disc
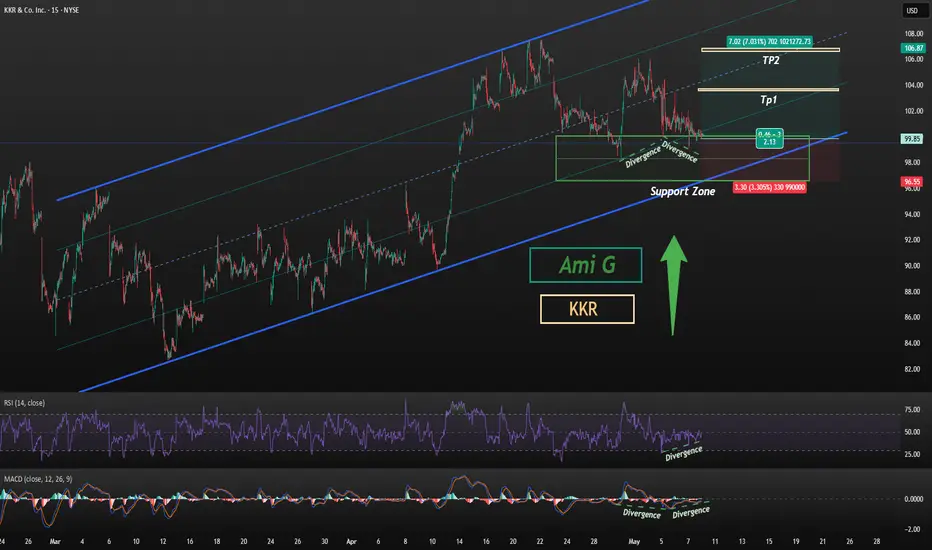
Live trading on KKR stock.Live trading on KKR stock. NYSE:KKR
Price continues to respect its primary channel structure and has now reached a key support zone.
At the same time, both MACD and RSI are showing clear bullish divergences, suggesting this area could act as a valid reaction zone.
In addition, one of our trading systems has triggered a buy signal, making this region attractive for a potential long position.
From here, price could potentially move:
first toward TP1
and then continue higher toward TP2 if mo
Gold Ready to Hit New High TargetsGold is currently reacting near a strong support zone around 4670, where buyers are attempting to defend the market after a short-term pullback. The price remains inside a broader bullish structure, and the Ichimoku cloud suggests that momentum could shift back upward if resistance is broken.
Key Observations:
Strong support holding near 4670 – 4660
Consolidation phase indicates possible accumulation
Buyers need a breakout above 4720 for confirmation
Bullish momentum could accelerate toward high
EURUSD H4 | Symmetrical Triangle — FVG Sweep Below Before Major Bias: Bullish (After Bearish Liquidity Grab )
EURUSD is compressing inside a Symmetrical Triangle on the 4H timeframe following a massive bullish impulse from the 1.1435 lows. Price is coiling tighter with each swing — a major breakout is approaching. The higher probability play is a sweep of the FVG below before the real bullish move begins.
Technical Confluence
Symmetrical Triangle clearly defined — lower highs and higher lows compressing price
CHoCH (Change of Character) confirmed bulli