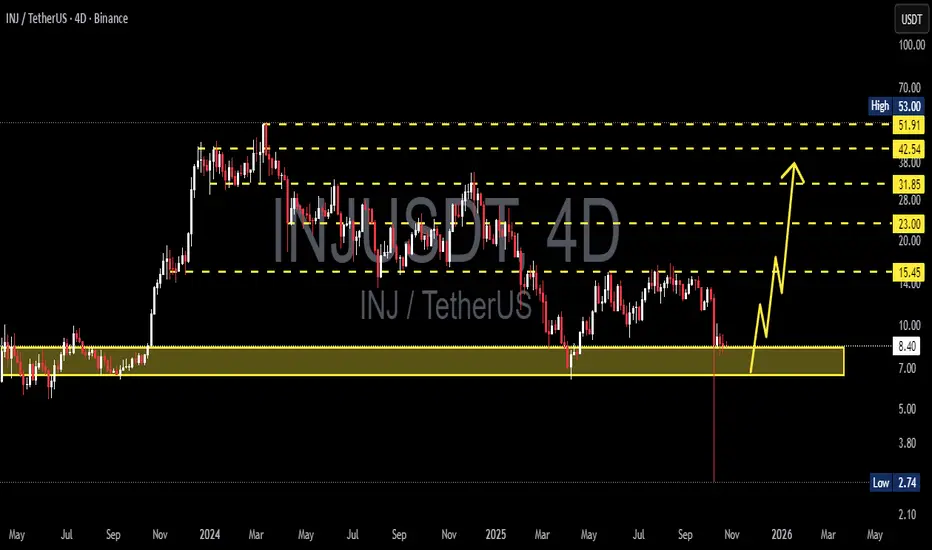
INJ is standing at its most crucial turning point since 2023, once again testing the legendary support zone between $6.5–$8.3 — the same area that previously sparked one of its most explosive rallies all the way up to $53.
This yellow block on the chart isn’t just an ordinary support; it represents the last stronghold of the bulls — the place where the market once flipped from distribution to euphoria. Now, that fortress is being tested again under relentless bearish pressure since mid-2024.
---
📉 Technical Structure:
Primary Trend: Still in a medium-term downtrend (series of lower highs and lower lows).
Key Support Zone (Demand Area): $6.5 – $8.3
Major Resistances: $15.45 → $23.00 → $31.85 → $42.54 → $51.91
Historical Low: $2.74
A long downside wick observed earlier signals extreme liquidity events — likely the result of large-scale stop-hunting or a capitulation flush. Yet, the quick candle recovery indicates that buyers are still defending below this area.
---
📈 Bullish Scenario:
If price manages to hold above the yellow zone and prints a bullish engulfing candle on the 4D timeframe with rising volume, a strong rebound could emerge.
The first upside target would be $15.45, and if momentum builds alongside a forming higher-low structure, the market could extend toward the $23.00–$31.85 range to confirm a medium-term trend reversal.
A clean breakout and close above $23.00 would confirm a major trend reversal, potentially reopening the path to retest the higher supply zones between $42–$51.
---
📉 Bearish Scenario:
However, if INJ fails to hold above $6.5 and confirms a 4D candle close below the yellow support zone, the market could enter another distribution phase.
Downside targets would then be $3.80, followed by the historical low at $2.74, which may act as the final liquidity magnet.
A confirmed breakdown below this support would reinforce seller dominance and likely extend the ongoing downtrend into deeper price territory.
---
📊 Summary:
The yellow zone on this chart is INJ’s “make-or-break” fortress.
If it holds, the market could witness the beginning of a new accumulation phase before a potential breakout. But if this wall collapses, the chart could rewrite its story toward deeper single-digit levels.
Either way, this zone represents the highest confluence of risk and opportunity — the decisive battleground that will shape INJ’s next major trend.
---
🧭 Trading Notes:
Conservative traders: Wait for a confirmed 4D close above the yellow zone before entering long positions.
Aggressive traders: Consider scaling into positions within the zone with a stop loss below $6.5.
Short-sellers: Watch for rejections around $15.45 — a failed breakout there could offer swing short opportunities back toward the $8 region.
Risk management remains key — never let emotion override structure.
---
#INJ #Injective #INJUSDT #CryptoAnalysis #TechnicalAnalysis #PriceAction #SupportZone #SwingTrade #CryptoMarket #MarketStructure #TrendAnalysis #BullishVsBearish
✅ Get Free Signals! Join Our Telegram Channel Here: t.me/TheCryptoNuclear
✅ Twitter: twitter.com/crypto_nuclear
✅ Join Bybit : partner.bybit.com/b/nuclearvip
✅ Benefits : Lifetime Trading Fee Discount -50%
✅ Twitter: twitter.com/crypto_nuclear
✅ Join Bybit : partner.bybit.com/b/nuclearvip
✅ Benefits : Lifetime Trading Fee Discount -50%
Disclaimer
The information and publications are not meant to be, and do not constitute, financial, investment, trading, or other types of advice or recommendations supplied or endorsed by TradingView. Read more in the Terms of Use.