Key Level: 684 (former resistance, now retesting as support)
Price Action Summary:
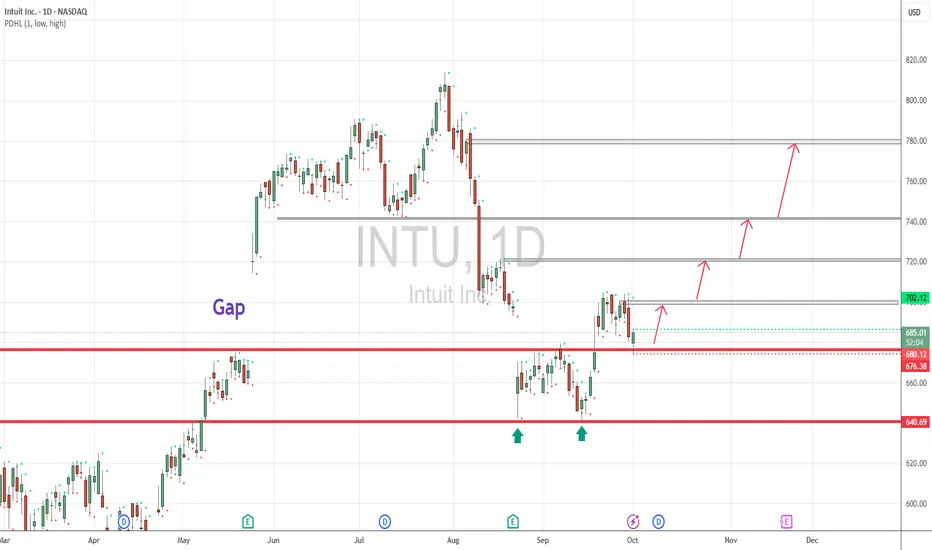
- INTU recently broke above 684 and is currently retesting this level on the daily chart.
- This zone is critical: hold above = bullish, break below = bearish.
Bullish Scenario:
Daily candles show rejection at 684 → buyers defending the level.
Potential upside targets: 710 → 740.
Look for pin bars, bullish engulfing, or strong closes above 684 as confirmation.
Trade direction should follow price reaction at this zone.
Tip: Keep it pure price action — no indicators needed. Watch daily candle structure carefully.
Price Action Summary:
- INTU recently broke above 684 and is currently retesting this level on the daily chart.
- This zone is critical: hold above = bullish, break below = bearish.
Bullish Scenario:
Daily candles show rejection at 684 → buyers defending the level.
Potential upside targets: 710 → 740.
Look for pin bars, bullish engulfing, or strong closes above 684 as confirmation.
Trade direction should follow price reaction at this zone.
Tip: Keep it pure price action — no indicators needed. Watch daily candle structure carefully.
Disclaimer
The information and publications are not meant to be, and do not constitute, financial, investment, trading, or other types of advice or recommendations supplied or endorsed by TradingView. Read more in the Terms of Use.
Disclaimer
The information and publications are not meant to be, and do not constitute, financial, investment, trading, or other types of advice or recommendations supplied or endorsed by TradingView. Read more in the Terms of Use.