Intuit: Ready to Change the Rules
Hello team,
Today I've been fascinated by the development on the chart of Intuit Inc. $NASDAQ:INTU.
When we look at the markets, we often search for chaos, but sometimes, the price action paints a picture of clarity and opportunity.
If we take a step back and observe the long-term trend, Intuit has formed what appears to be a classic Cup & Handle or an Ascending Triangle. While these patterns differ slightly in shape, they sing the same song: Continuation.
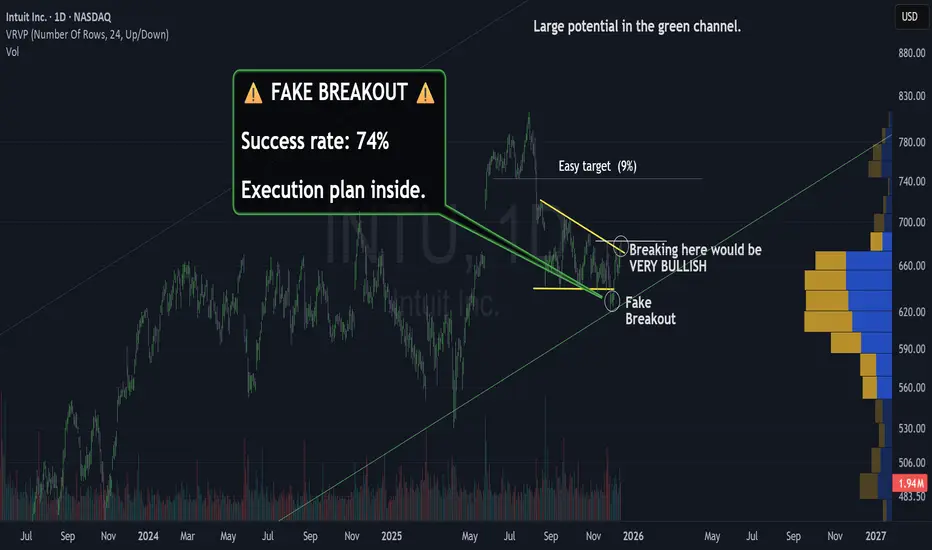
After a strong run, the stock is currently in a healthy pullback phase.

In the Daily Time frame, we recently witnessed a short squeeze that served as a wake-up call, creating a crystal-clear trend reversal pattern.
The Fake Breakout to the downside (visible on the chart) was quickly bought up, showing that buyers are eagerly defending these levels.
💡 But… Why that happened?
If you look at that violent U-turn on November 21st for INTU,
INTU,  ADBE or
  CRM, it wasn’t a coincidence.
It was the day the market received the Proof of Life for the Software sector.
Here is the story behind the charts:
Until that week, the Wall Street fear was:
“AI is great for Nvidia (Hardware), but it will kill Software (SaaS) by replacing human seats.”
On November 21st, that fear died, because of a Triple Confirmation that happened in less than 24 hours:
1. Snowflake ( SNOW ) crushed earnings and sent a clear message: Corporate spending is back. Companies aren’t cutting software, they are organizing their data to build AI agents.
2. Intuit (INTU ) Intuit proved that AI features (like “Intuit Assist”) aren’t just hype, they are actually generating new revenue.
3. A Fundamental Short Squeeze Suddenly, investors realized AI isn’t the enemy of Software, it is the growth engine. Thousands of traders who were betting against these stocks got trapped. They all rushed to the exit at the same time, triggering those explosive vertical green candles you saw.
Price doesn’t just move on numbers, it moves when a story changes. And on Nov 21, the story changed and the charts are showing it to us clearly.
⚔️ My Battle Plan
We do not predict, we react to critical levels. Here is the roadmap for the coming weeks:
Entry point: We are waiting for a decisive breakout above the $683 level. This is the resistance that must be cleared with volume to confirm the move.
🛡️ Stop Loss inside the pattern, around 3-4%.
🎯 First Target (Short Term): Once $683 is broken, the chart suggests an easy target of approximately 9% to the upside.
🎯 The Green Channel (Long Term): If the bullish momentum sustains and we travel toward the upper boundary of the long-term channel, we could be looking at highly attractive returns of up to 30%.
Let the market come to you. Patience is the trader's greatest edge.
🎁 Let’s make a simple deal.
I will handle the heavy lifting to find the top 1% of setups like this, and you just HIT the 🚀 Rocket, Follow and Enjoy.
🤝 Deal?
Hello team,
Today I've been fascinated by the development on the chart of Intuit Inc. $NASDAQ:INTU.
When we look at the markets, we often search for chaos, but sometimes, the price action paints a picture of clarity and opportunity.
If we take a step back and observe the long-term trend, Intuit has formed what appears to be a classic Cup & Handle or an Ascending Triangle. While these patterns differ slightly in shape, they sing the same song: Continuation.
After a strong run, the stock is currently in a healthy pullback phase.
In the Daily Time frame, we recently witnessed a short squeeze that served as a wake-up call, creating a crystal-clear trend reversal pattern.
The Fake Breakout to the downside (visible on the chart) was quickly bought up, showing that buyers are eagerly defending these levels.
💡 But… Why that happened?
If you look at that violent U-turn on November 21st for
It was the day the market received the Proof of Life for the Software sector.
Here is the story behind the charts:
Until that week, the Wall Street fear was:
“AI is great for Nvidia (Hardware), but it will kill Software (SaaS) by replacing human seats.”
On November 21st, that fear died, because of a Triple Confirmation that happened in less than 24 hours:
1. Snowflake (
2. Intuit (
3. A Fundamental Short Squeeze Suddenly, investors realized AI isn’t the enemy of Software, it is the growth engine. Thousands of traders who were betting against these stocks got trapped. They all rushed to the exit at the same time, triggering those explosive vertical green candles you saw.
Price doesn’t just move on numbers, it moves when a story changes. And on Nov 21, the story changed and the charts are showing it to us clearly.
⚔️ My Battle Plan
We do not predict, we react to critical levels. Here is the roadmap for the coming weeks:
Entry point: We are waiting for a decisive breakout above the $683 level. This is the resistance that must be cleared with volume to confirm the move.
🛡️ Stop Loss inside the pattern, around 3-4%.
🎯 First Target (Short Term): Once $683 is broken, the chart suggests an easy target of approximately 9% to the upside.
🎯 The Green Channel (Long Term): If the bullish momentum sustains and we travel toward the upper boundary of the long-term channel, we could be looking at highly attractive returns of up to 30%.
Let the market come to you. Patience is the trader's greatest edge.
🎁 Let’s make a simple deal.
I will handle the heavy lifting to find the top 1% of setups like this, and you just HIT the 🚀 Rocket, Follow and Enjoy.
🤝 Deal?
🚀 Simple Chart Patterns. Serious Profits.
📈 +200% returns
🎯 70%+ win rate (audited)
Trade smarter, not harder.
👉topchartpatterns.substack.com/subscribe
📩 Business: info@topchartpatterns.com
📈 +200% returns
🎯 70%+ win rate (audited)
Trade smarter, not harder.
👉topchartpatterns.substack.com/subscribe
📩 Business: info@topchartpatterns.com
Related publications
Disclaimer
The information and publications are not meant to be, and do not constitute, financial, investment, trading, or other types of advice or recommendations supplied or endorsed by TradingView. Read more in the Terms of Use.