📊 Supply & Demand View 📊
If you’ve been watching IOL Chemicals lately, you’ve probably noticed how cleanly it’s been respecting those key supply and demand structures. These zones aren’t random—they’re the visible fingerprints of institutions building or offloading positions in stages. When price revisits such levels, we often see sharp, almost surgical reactions.

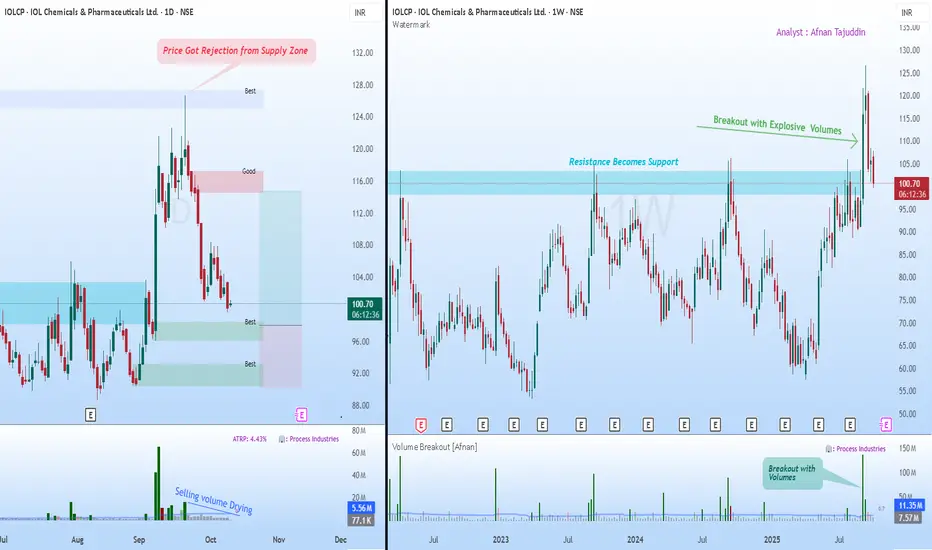
Now, what’s catching my eye on the daily chart is the recent rejection from a supply zone. The pushback was clear, triggering a short-term decline. But here’s where it gets interesting: the selling volume has been steadily tapering off. That usually suggests the aggressive sellers are stepping aside, hinting that downside momentum could be losing steam.
Meanwhile, we’ve got multiple untested demand zones forming below—areas where buyers have shown conviction before. If price drifts into one of these regions again, I wouldn’t be surprised to see a fresh wave of institutional buying step in.
🚀 Breakout Retest View 🚀

Zooming out to the weekly chart tells a complementary story. After grinding under a major resistance for months, the stock finally broke through with explosive volume—the kind that only big money typically leaves behind. That breakout wasn’t just a blip; it reset the broader structure.
Now, the same resistance level has flipped into support—a textbook case of the law of polarity. As long as price continues to respect that zone, the larger trend remains firmly constructive.
What I find compelling is the combination of elements here: strong breakout volume, a healthy pullback, and structure alignment across timeframes. All signs point to this being a typical retest phase rather than a reversal.
✨ Final Takeaway ✨
Both charts are speaking the same language. The daily timeframe is hinting at exhaustion from sellers, while the weekly view reinforces the idea of a bullish continuation once demand reasserts itself. Should price stabilize around those lower demand zones, we could be looking at the next leg of the trend unfolding from there.
💡 Risk Management Reminder 💡
It’s easy to get carried away when the setup looks clean, but the market doesn’t owe certainty to anyone. Stick to your stop-loss, size your positions with care, and remember that discipline—more than any indicator—is what protects your capital.
🔄 Stay patient, stay consistent — the market rewards preparation, not prediction. 🔄
This breakdown is shared purely for educational purposes and shouldn’t be taken as a trading or investment recommendation. I’m not a SEBI-registered analyst.
If you’ve been watching IOL Chemicals lately, you’ve probably noticed how cleanly it’s been respecting those key supply and demand structures. These zones aren’t random—they’re the visible fingerprints of institutions building or offloading positions in stages. When price revisits such levels, we often see sharp, almost surgical reactions.
Now, what’s catching my eye on the daily chart is the recent rejection from a supply zone. The pushback was clear, triggering a short-term decline. But here’s where it gets interesting: the selling volume has been steadily tapering off. That usually suggests the aggressive sellers are stepping aside, hinting that downside momentum could be losing steam.
Meanwhile, we’ve got multiple untested demand zones forming below—areas where buyers have shown conviction before. If price drifts into one of these regions again, I wouldn’t be surprised to see a fresh wave of institutional buying step in.
🚀 Breakout Retest View 🚀
Zooming out to the weekly chart tells a complementary story. After grinding under a major resistance for months, the stock finally broke through with explosive volume—the kind that only big money typically leaves behind. That breakout wasn’t just a blip; it reset the broader structure.
Now, the same resistance level has flipped into support—a textbook case of the law of polarity. As long as price continues to respect that zone, the larger trend remains firmly constructive.
What I find compelling is the combination of elements here: strong breakout volume, a healthy pullback, and structure alignment across timeframes. All signs point to this being a typical retest phase rather than a reversal.
✨ Final Takeaway ✨
Both charts are speaking the same language. The daily timeframe is hinting at exhaustion from sellers, while the weekly view reinforces the idea of a bullish continuation once demand reasserts itself. Should price stabilize around those lower demand zones, we could be looking at the next leg of the trend unfolding from there.
💡 Risk Management Reminder 💡
It’s easy to get carried away when the setup looks clean, but the market doesn’t owe certainty to anyone. Stick to your stop-loss, size your positions with care, and remember that discipline—more than any indicator—is what protects your capital.
“Charts reveal opportunities, but discipline secures profits.”
🔄 Stay patient, stay consistent — the market rewards preparation, not prediction. 🔄
This breakdown is shared purely for educational purposes and shouldn’t be taken as a trading or investment recommendation. I’m not a SEBI-registered analyst.
Access the powerful Demand and Supply Zone Pro indicator at:
marketup2date.com
Stay updated on Telegram:
t.me/MarketUp2Date
Join our WhatsApp channel:
whatsapp.com/channel/0029Va6ByyH0LKZCc4Az4x0u
marketup2date.com
Stay updated on Telegram:
t.me/MarketUp2Date
Join our WhatsApp channel:
whatsapp.com/channel/0029Va6ByyH0LKZCc4Az4x0u
Related publications
Disclaimer
The information and publications are not meant to be, and do not constitute, financial, investment, trading, or other types of advice or recommendations supplied or endorsed by TradingView. Read more in the Terms of Use.