📌 Overview
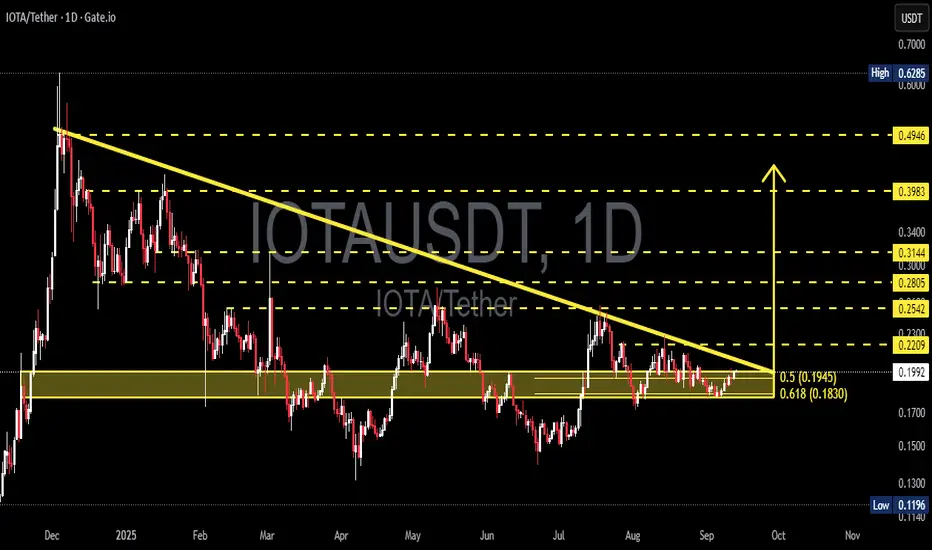
The daily chart of IOTA is reaching a critical decision point. After months of being pressured by a long-term descending trendline, the price still manages to hold above the demand zone at 0.183 – 0.195 USDT (a confluence of the 0.618 & 0.5 Fibonacci retracements).
This structure has formed a descending triangle / falling wedge, which tells us:
Buyers are consistently defending the demand zone.
Sellers are pushing with lower highs, squeezing the price tighter and tighter.
This creates a classic “make or break” setup — either IOTA breaks out with momentum or breaks down into lower levels.
---
📊 Technical Structure & Pattern
Main Pattern: Descending triangle / falling wedge.
Dynamic Resistance: Downtrend line (~0.22–0.225).
Key Support / Demand Zone: 0.183 – 0.195 USDT (Fibo 0.618 & 0.5).
Upside Targets if Breakout: 0.254 → 0.280 → 0.314 → 0.398 → 0.495.
Downside Targets if Breakdown: 0.15 → 0.13 → 0.1196 (historical low).
---
🚀 Bullish Scenario
1. Confirmation: Daily close above 0.22–0.225 (trendline breakout).
2. Why it matters: A breakout would signal the end of the multi-month downtrend and attract new buying momentum.
3. Targets:
First target: 0.2542 USDT.
Next zones: 0.2805 – 0.3144.
Strong breakout momentum could extend toward 0.398 – 0.495.
4. Stop-loss: Below 0.183 support cluster.
Bullish narrative: If buyers manage to break the descending wall, IOTA could enter a new trend reversal phase, pulling fresh interest from sidelined investors.
---
📉 Bearish Scenario
1. Confirmation: Daily close below 0.183 with strong volume.
2. Why it matters: This would signal that demand has collapsed, giving sellers full control.
3. Targets:
First target: 0.15 – 0.13 USDT.
Extended target: 0.1196 USDT (historical low).
4. Stop-loss: Above 0.195–0.22 depending on entry.
Bearish narrative: A breakdown here could trigger a capitulation phase, sending IOTA into deeper lows before a new base is found.
---
🔑 Why This Chart is Important
Confluence Zone: Trendline resistance + Fibonacci retracement + demand zone converge at the same area.
High Probability Setup: Either direction, the move is likely to be strong.
Clear Risk/Reward: Levels are well defined, giving traders precise setups.
Daily Close + Volume = Key: No confirmation means high risk of false breakouts.
---
📌 Conclusion
IOTA is at a technical crossroads:
Bullish case: Breakout >0.22 could lead to 0.254 → 0.314+.
Bearish case: Breakdown <0.183 could lead to 0.15 → 0.1196.
👉 Traders should wait for daily close confirmation with volume before committing to big positions.
👉 Investors should watch closely — this zone will determine whether IOTA starts a reversal or extends its downtrend.
---
#IOTA #IOTAUSDT #Crypto #TechnicalAnalysis #ChartAnalysis #PriceAction #Breakout #SupportResistance #Fibonacci #CryptoTrading #Altcoins
✅ Get Free Signals! Join Our Telegram Channel Here: t.me/TheCryptoNuclear
✅ Twitter: twitter.com/crypto_nuclear
✅ Join Bybit : partner.bybit.com/b/nuclearvip
✅ Benefits : Lifetime Trading Fee Discount -50%
✅ Twitter: twitter.com/crypto_nuclear
✅ Join Bybit : partner.bybit.com/b/nuclearvip
✅ Benefits : Lifetime Trading Fee Discount -50%
Disclaimer
The information and publications are not meant to be, and do not constitute, financial, investment, trading, or other types of advice or recommendations supplied or endorsed by TradingView. Read more in the Terms of Use.