Hello everyone, if you like the idea, do not forget to support with a like and follow.
I found IOTA chart interesting! ( H4 timeframe )
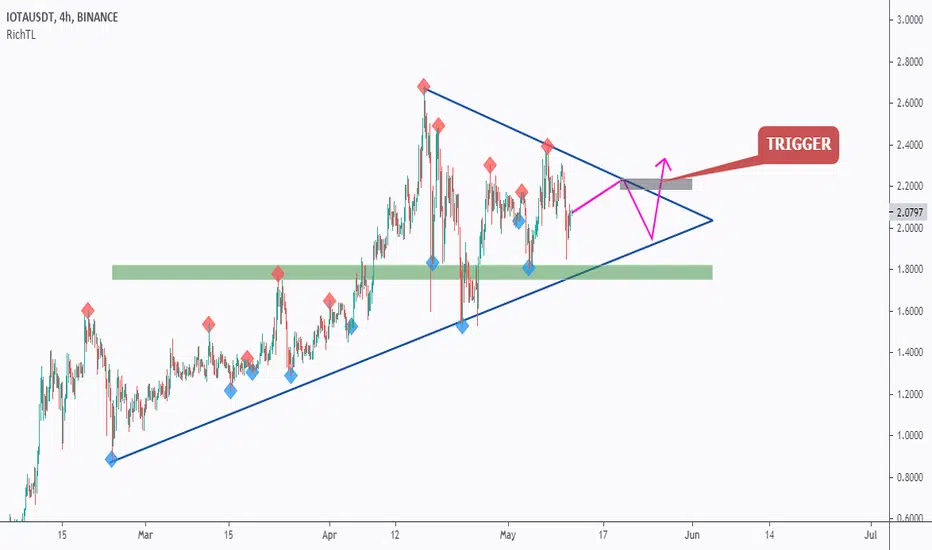
IOTA is overall bullish trading above the lower blue trendline.
However, now it is stuck inside a range in the shape of a symmetrical triangle. And every new candle is making the range even narrower.
Well as per the textbook, a symmetrical triangle is a bilateral pattern, which means it can be broken on either side.
I am looking to add IOTA to my portfolio, but before we buy, we want the buyers to prove that they are taking over.
As per my trading plan, I will be waiting for a new swing to form around the upper blue trendline, (projection in purple) to consider it valid then enter on its break upward. (gray zone)
And of course, as price approaches the lower blue trendline and green zone, we will also be looking for buy setups on lower timeframes. (short-term)
Good luck!
All Strategies Are Good; If Managed Properly!
~Rich
I found IOTA chart interesting! ( H4 timeframe )
IOTA is overall bullish trading above the lower blue trendline.
However, now it is stuck inside a range in the shape of a symmetrical triangle. And every new candle is making the range even narrower.
Well as per the textbook, a symmetrical triangle is a bilateral pattern, which means it can be broken on either side.
I am looking to add IOTA to my portfolio, but before we buy, we want the buyers to prove that they are taking over.
As per my trading plan, I will be waiting for a new swing to form around the upper blue trendline, (projection in purple) to consider it valid then enter on its break upward. (gray zone)
And of course, as price approaches the lower blue trendline and green zone, we will also be looking for buy setups on lower timeframes. (short-term)
Good luck!
All Strategies Are Good; If Managed Properly!
~Rich
Trade Made Simple
RichTL.com
Telegram
t.me/thesignalyst
CFD broker - Tickmill
cutt.ly/TickmillReal
Veles - Create Trading Bots
veles.finance/invite/thesignalyst
RichTL.com
Telegram
t.me/thesignalyst
CFD broker - Tickmill
cutt.ly/TickmillReal
Veles - Create Trading Bots
veles.finance/invite/thesignalyst
Disclaimer
The information and publications are not meant to be, and do not constitute, financial, investment, trading, or other types of advice or recommendations supplied or endorsed by TradingView. Read more in the Terms of Use.