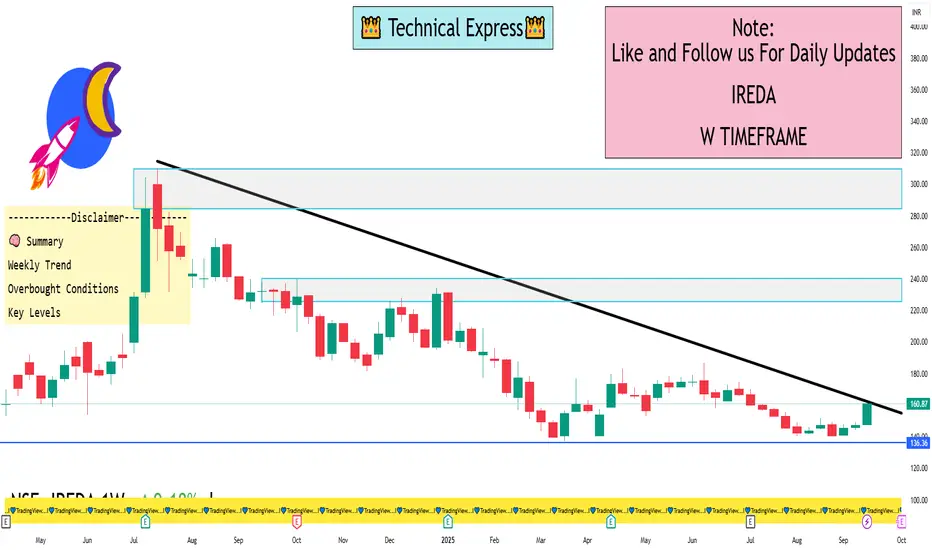
📈 Current Price & Trend
Latest Price: ₹160.87
Weekly Change: +9.14%
52-Week Range: ₹137.01 – ₹239.90
Market Cap: ₹45,192 Cr
🔍 Technical Indicators (Weekly)
RSI (14): 62.41 — Neutral to Bullish
MACD (12,26): 0.05 — Slight Bullish Crossover
ADX (14): 23.78 — Neutral Trend Strength
Stochastic RSI: 85.02 — Overbought Signal
Williams %R: -9.76 — Overbought Signal
CCI (14): 171.45 — Overbought Signal
ROC (14): 6.10 — Bullish Momentum
📊 Moving Averages (Weekly)
5-Day EMA: ₹149.41 — Bullish
10-Day EMA: ₹147.30 — Bullish
20-Day EMA: ₹146.27 — Bullish
50-Day EMA: ₹150.48 — Bullish
100-Day EMA: ₹158.11 — Bearish
200-Day EMA: ₹172.56 — Bearish
🔁 Pivot Levels
Support Levels: ₹145.02 (S1), ₹142.23 (S2)
Resistance Levels: ₹161.88 (R1), ₹158.12 (R2)
Pivot Point: ₹151.57
🧠 Summary
Weekly Trend: Bullish momentum with a strong uptrend.
Overbought Conditions: Indicators like Stochastic RSI, Williams %R, and CCI suggest potential short-term pullback.
Key Levels: Watch for support at ₹145.02 and resistance at ₹161.88.
I built a Buy & Sell Signal Indicator with 85% accuracy.
📈 Get access via DM or
WhatsApp: wa.link/d997q0
| Email: techncialexpress@gmail.com
| Script Coder | Trader | Investor | From India
📈 Get access via DM or
WhatsApp: wa.link/d997q0
| Email: techncialexpress@gmail.com
| Script Coder | Trader | Investor | From India
Related publications
Disclaimer
The information and publications are not meant to be, and do not constitute, financial, investment, trading, or other types of advice or recommendations supplied or endorsed by TradingView. Read more in the Terms of Use.