The full chart pattern analysis for ITC Hotels Ltd. chart you shared 👇
Technical Analysis (Daily Chart)
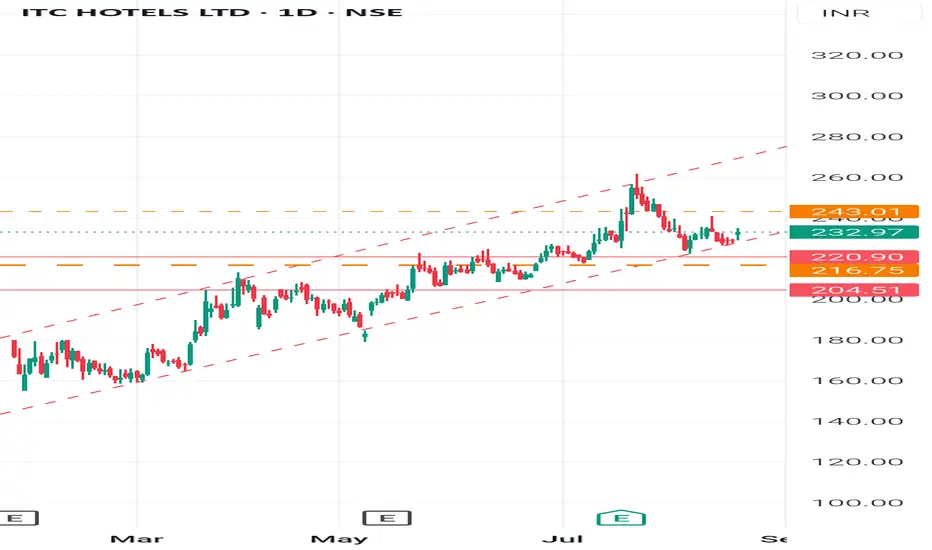
Current Price: - 233 (+1.82%)
Trend: Stock has been in an upward channel (red dashed lines). After touching - 260+zone, it corrected and is now consolidating.
Support Levels:
- 220.90 (strong support, recent bounce zone)
- 216.75 (channel support)
- 204.50 (major support, breakdown point)
Resistance Levels:
- 243.00 (immediate hurdle, previous swing high)
- 260.00 (upper channel resistance)
- 280+ (if breakout sustains, long-term target)
Pattern: Stock is moving in a rising channel and now forming a sideways consolidation. A close above - 243 can resume uptrend; below - 216 may lead to deeper correction.
Fundamentals Snapshot (Competition vs. ITC Hotels)
(Hotel industry peers: Indian Hotels (Taj), EIH (Oberoi), Lemon Tree, Chalet Hotels)
Company P/E Ratio P/B Ratio Debt/Equity ROE Net Profit Margin
ITC Hotels Ltd - 28x - 3.5x Low - 12% - 8%
Indian Hotels (Taj) - 45x - 6x Low - 14% - 10%
EIH (Oberoi) - 55x - 4.2x Low - 10% - 7%
Lemon Tree Hotels Loss-making recently - High Negative Negative
Chalet Hotels - 75x - 6x Moderate - 9% - 5%
Key Observations:
-ITC Hotels trades at a cheaper valuation (P/E 28x) compared to peers like Taj (45x) and Chalet (75x).
-The balance sheet is debt-light, which is a positive.
+Margins are stable but slightly lower than Taj.
-Strong backing of parent ITC Ltd. makes it relatively safer than standalone hotel chains.
👉Disclaimer-:
This is an educational analysis based on publicly available data and technical charting. It is not financial advice. Please consult your financial advisor before making any investment decisions. Stock markets are subject to risks.
#ITCHotels #StockMarketIndia #TechnicalAnalysis #HotelIndustry #LongTermInvesting #NSEStocks #BSEStocks #SupportAndResistance #SmartInvesting #StockMarketEducation
Technical Analysis (Daily Chart)
Current Price: - 233 (+1.82%)
Trend: Stock has been in an upward channel (red dashed lines). After touching - 260+zone, it corrected and is now consolidating.
Support Levels:
- 220.90 (strong support, recent bounce zone)
- 216.75 (channel support)
- 204.50 (major support, breakdown point)
Resistance Levels:
- 243.00 (immediate hurdle, previous swing high)
- 260.00 (upper channel resistance)
- 280+ (if breakout sustains, long-term target)
Pattern: Stock is moving in a rising channel and now forming a sideways consolidation. A close above - 243 can resume uptrend; below - 216 may lead to deeper correction.
Fundamentals Snapshot (Competition vs. ITC Hotels)
(Hotel industry peers: Indian Hotels (Taj), EIH (Oberoi), Lemon Tree, Chalet Hotels)
Company P/E Ratio P/B Ratio Debt/Equity ROE Net Profit Margin
ITC Hotels Ltd - 28x - 3.5x Low - 12% - 8%
Indian Hotels (Taj) - 45x - 6x Low - 14% - 10%
EIH (Oberoi) - 55x - 4.2x Low - 10% - 7%
Lemon Tree Hotels Loss-making recently - High Negative Negative
Chalet Hotels - 75x - 6x Moderate - 9% - 5%
Key Observations:
-ITC Hotels trades at a cheaper valuation (P/E 28x) compared to peers like Taj (45x) and Chalet (75x).
-The balance sheet is debt-light, which is a positive.
+Margins are stable but slightly lower than Taj.
-Strong backing of parent ITC Ltd. makes it relatively safer than standalone hotel chains.
👉Disclaimer-:
This is an educational analysis based on publicly available data and technical charting. It is not financial advice. Please consult your financial advisor before making any investment decisions. Stock markets are subject to risks.
#ITCHotels #StockMarketIndia #TechnicalAnalysis #HotelIndustry #LongTermInvesting #NSEStocks #BSEStocks #SupportAndResistance #SmartInvesting #StockMarketEducation
Related publications
Disclaimer
The information and publications are not meant to be, and do not constitute, financial, investment, trading, or other types of advice or recommendations supplied or endorsed by TradingView. Read more in the Terms of Use.
Related publications
Disclaimer
The information and publications are not meant to be, and do not constitute, financial, investment, trading, or other types of advice or recommendations supplied or endorsed by TradingView. Read more in the Terms of Use.