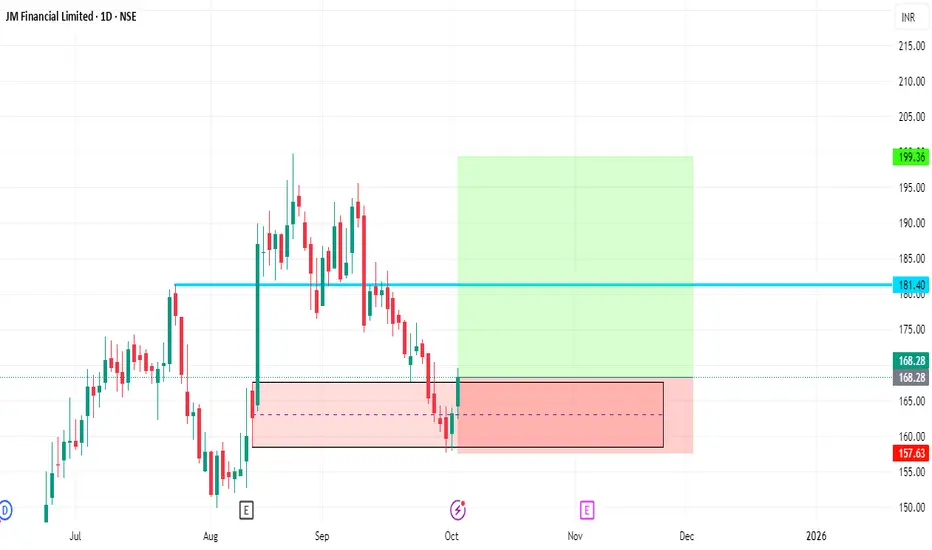
Sharing a fresh daily chart setup for JM Financial Limited (NSE:JMFINANCIL). The price has recently bounced from a strong support zone in the ₹162–₹168 range, showing signs of strength after a prolonged decline. Increased volume at this level indicates renewed buyer interest.
Trade Plan
Entry Zone: ₹162–₹168 (Demand area recently respected)
Stop Loss: ₹157 (Below recent swing low)
Primary Targets: ₹181 (short-term), ₹199 (medium-term)
Chart Observations
Price pulled back to an accumulation zone with marked demand.
Bullish reversal candlestick formation observed near support.
Attractive risk-reward setup with well-defined invalidation and multiple upside targets.
Watch for confirmation above ₹181, which may bring further buying momentum.
Notes
This setup uses technical support/resistance, volume spike, and price action for a disciplined trade approach.
Strong risk management is recommended, as structure may shift quickly; monitor stops and trail profits as price approaches resistance targets.
Disclaimer
This idea is for educational sharing only and not investment advice. Please conduct your own research before entering any positions
Disclaimer
The information and publications are not meant to be, and do not constitute, financial, investment, trading, or other types of advice or recommendations supplied or endorsed by TradingView. Read more in the Terms of Use.
Disclaimer
The information and publications are not meant to be, and do not constitute, financial, investment, trading, or other types of advice or recommendations supplied or endorsed by TradingView. Read more in the Terms of Use.