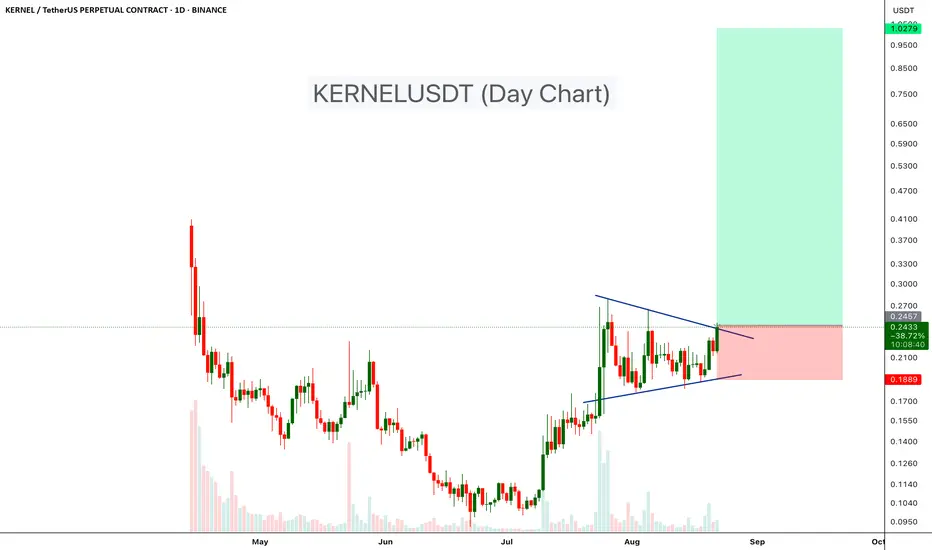
KERNELUSDT has been consolidating within a symmetrical triangle pattern on the daily chart, showing a battle between buyers and sellers after a strong uptrend. Recently, price has started breaking above the upper trendline, which could indicate the beginning of a fresh bullish move.
Pattern: Symmetrical Triangle
Entry Zone: Around current breakout levels (~0.24–0.25 USDT)
Target Zone: $0.5 - $1.00
Stop-Loss: Below 0.19 USDT (recent support)
Cheers
Hexa
Pattern: Symmetrical Triangle
Entry Zone: Around current breakout levels (~0.24–0.25 USDT)
Target Zone: $0.5 - $1.00
Stop-Loss: Below 0.19 USDT (recent support)
Cheers
Hexa
🚀Telegram : t.me/hexatrades
🌐Website: hexatrades.io/
🗣️Twitter(X): twitter.com/HexaTrades
🌐Website: hexatrades.io/
🗣️Twitter(X): twitter.com/HexaTrades
Related publications
Disclaimer
The information and publications are not meant to be, and do not constitute, financial, investment, trading, or other types of advice or recommendations supplied or endorsed by TradingView. Read more in the Terms of Use.