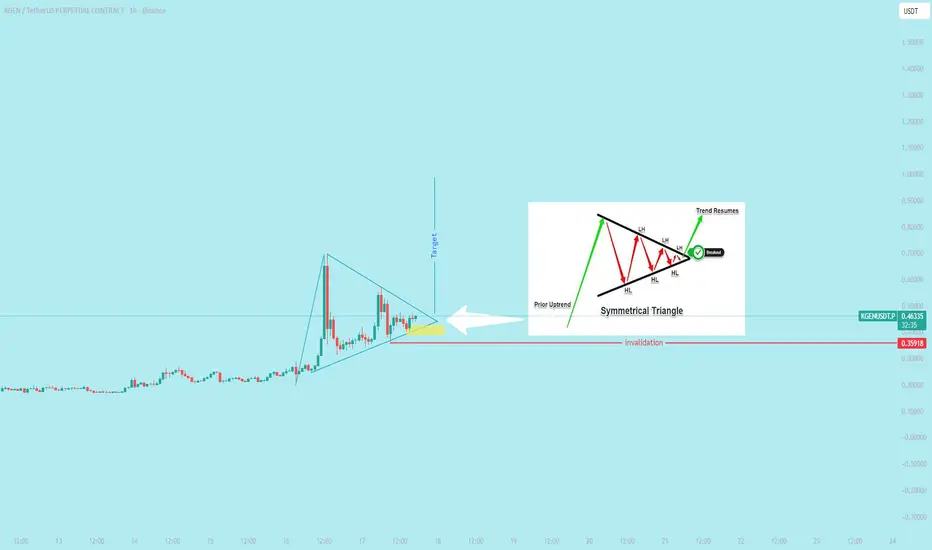
A bullish symmetrical triangle is a continuation pattern that signals a potential resumption of an uptrend. The pattern forms during a period of market indecision, where the price consolidates between a descending upper trendline and an ascending lower trendline. A confirmed breakout above the upper trendline suggests that buyers have regained control and the upward momentum is likely to continue.
Disclaimer
The information and publications are not meant to be, and do not constitute, financial, investment, trading, or other types of advice or recommendations supplied or endorsed by TradingView. Read more in the Terms of Use.
Disclaimer
The information and publications are not meant to be, and do not constitute, financial, investment, trading, or other types of advice or recommendations supplied or endorsed by TradingView. Read more in the Terms of Use.