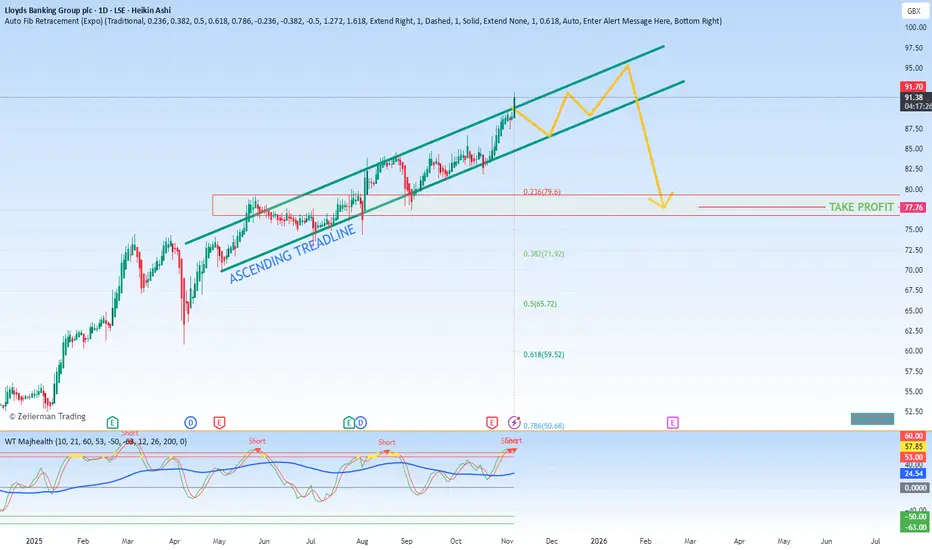
Based on the technical chart pattern observed in Lloyds Banking Group ( LLOY) on May 2nd, 2025, the stock is exhibiting a well-defined bullish structure known as an ascending channel. This pattern is characterized by a series of higher highs and higher lows, contained within two upward-sloping parallel trendlines.
The prevailing interpretation of this formation is bullish, suggesting that the upward momentum is likely to continue as long as the price action remains within the channel's boundaries. The key to this thesis is the lower trendline, which acts as dynamic support.
My trading strategy, therefore, is to remain bullish with a profit-taking target zone between 77p and 80p. This area is identified as a significant resistance level near the top of the channel where a price reaction is anticipated.
However, a critical contingency is in place. Should the price decisively break below and close under the ascending support line, the bullish premise would be invalidated. In this scenario, my plan is to treat this broken support level as new resistance and would consider it a signal to exit the long position to manage risk, as it could indicate a potential reversal or a period of consolidation.
Disclaimer
The information and publications are not meant to be, and do not constitute, financial, investment, trading, or other types of advice or recommendations supplied or endorsed by TradingView. Read more in the Terms of Use.
Disclaimer
The information and publications are not meant to be, and do not constitute, financial, investment, trading, or other types of advice or recommendations supplied or endorsed by TradingView. Read more in the Terms of Use.