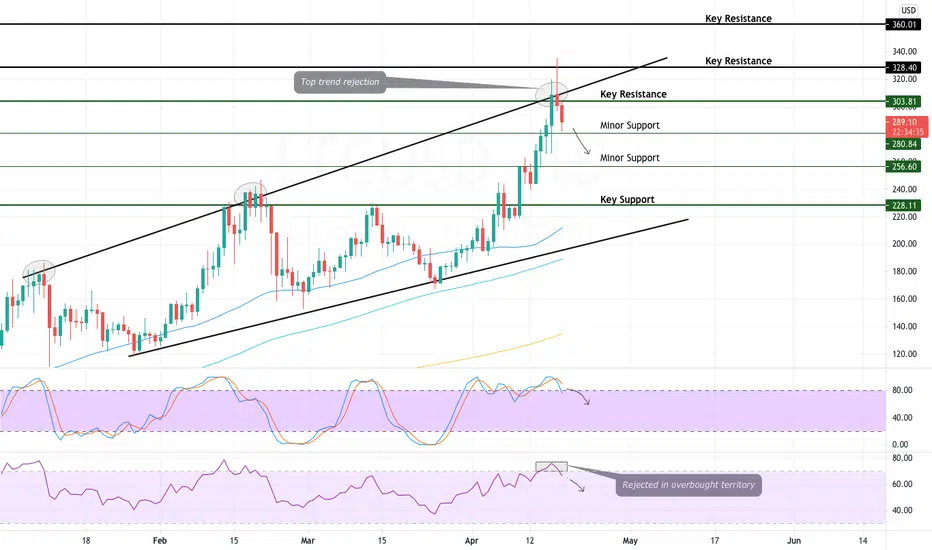
-LTC hits 3 year high
-Price has rejected at 3 month trend line
-Key support & resistance to hold is $303
LTC holders have been waiting patiently for the currency to show strides this bull run and it has began to perform. LTC was up nearly 60% in the last two weeks, hitting a high of $333. This price surge lost steam as the price of LTC attempted to break its 3 month trend line.
On the daily chart, we can see LTC has been moving within a 90 day channel. The price has bounced off the bottom of the channel 3 times as well as the top of the channel. Each time LTC experiences a bounce on this channel, the price moves in the bouncing direction for at least a week. This could signal LTC may reach lows of $230-$250 in the near future.
The key resistance for LTC to break hold is $303. If the bulls manage to hold this level, LTC may have a shot at its all time high of $420. At the time of writing, the important level to watch is $280 as the bulls must manage to hold this level in attempt of continuing this bullish trend. If the bears continue control and the $280 support fails to hold, expect a drop to the $250 range.
Looking at the Stochastic RSI, we can conclude the strength was pushed to its limits the last 5 days. Two rejections at the top value in overbought conditions would usually indicate a reset to lower levels. The regular RSI also can confirm this view as the strength was rejected in overbought conditions. LTC is considered bearish until $303 is broken.
LTC intraday levels
Spot rate: $286
Trend: Bullish
Volatility: High
Support: $280
Resistance: $303
Disclaimer
The information and publications are not meant to be, and do not constitute, financial, investment, trading, or other types of advice or recommendations supplied or endorsed by TradingView. Read more in the Terms of Use.
Disclaimer
The information and publications are not meant to be, and do not constitute, financial, investment, trading, or other types of advice or recommendations supplied or endorsed by TradingView. Read more in the Terms of Use.