MATIC / USDT 4H chart Targets and Stoploss
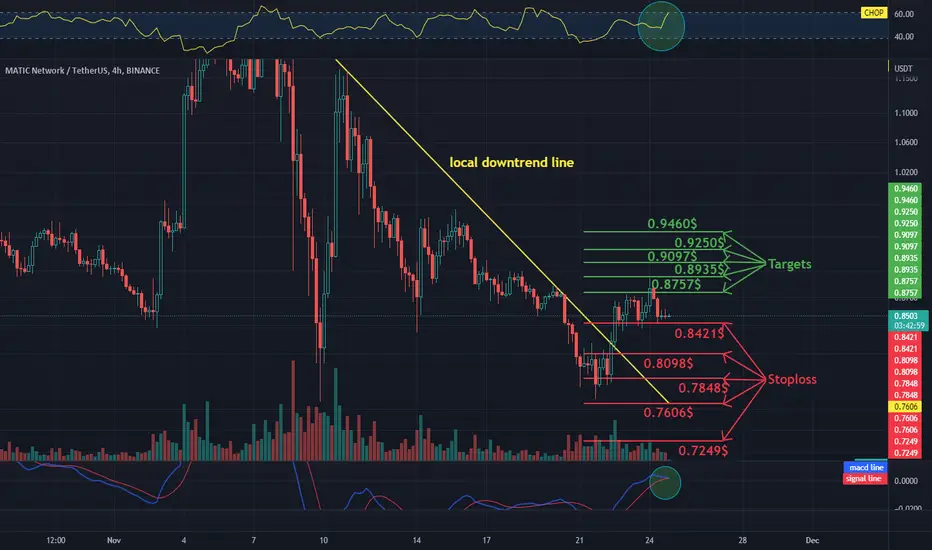
Hello everyone, let's look at the 4H MATIC to USDT chart as you can see that the price is moving above the local downtrend line.
Let's start by setting goals for the near future that we can take into account:
T1 = $0.8757
T2 = $0.8935
T3 = $0.9097
T4 = $0.9250
and
T5 =0.9460$
Now let's move on to the stop loss in case the market goes down further:
SL1 = $0.8421
SL2 = $0.8098
SL3 = $0.7848
SL4 = $0.7606
and
SL5 = $0.7249
Looking at the CHOP indicator, we see that the energy is heavily charged on the 4H time frame, the MACD indicator shows that it is in a local uptrend, while the volume is very low.
Disclaimer
The information and publications are not meant to be, and do not constitute, financial, investment, trading, or other types of advice or recommendations supplied or endorsed by TradingView. Read more in the Terms of Use.
Disclaimer
The information and publications are not meant to be, and do not constitute, financial, investment, trading, or other types of advice or recommendations supplied or endorsed by TradingView. Read more in the Terms of Use.