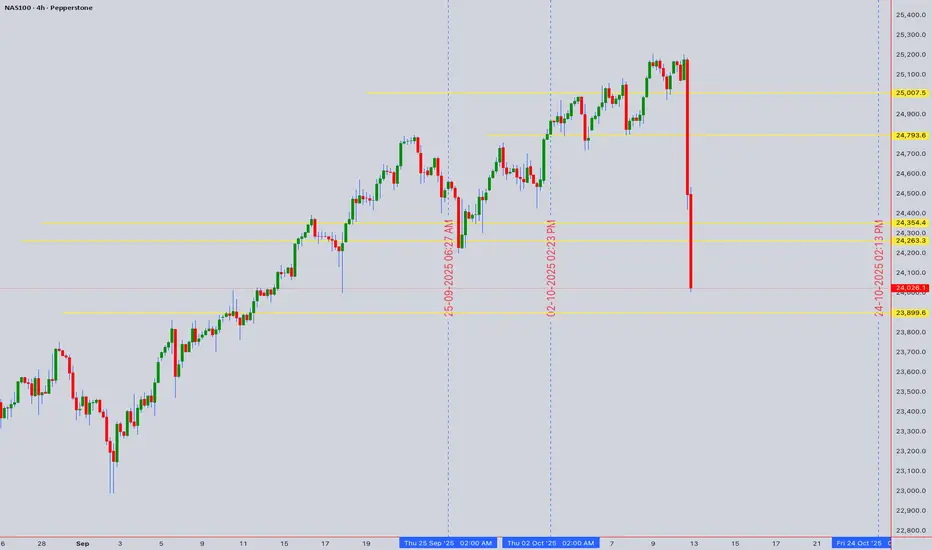
NAS100 Decision Point at All-Time Highs
Asset: NAS100 (NASDAQ 100) 11th Oct 2025 UTC+4
Closing Price: 24,026.1 | Bias: Neutral, awaiting breakout confirmation.
1. Multi-Timeframe Market Structure
Daily Chart Context: The index is in a powerful, sustained uptrend, trading near all-time highs. The recent consolidation suggests a pause within the broader bullish structure.
Critical Resistance: 24,200 - 24,300. A confluence of the recent swing high and a psychological barrier. A decisive daily close above 24,300 is the key bullish trigger.
Key Support Levels:
Immediate: 23,900 (Recent swing low & 4H consolidation base).
Primary: 23,650 - 23,750 (Previous resistance, now key support & 50 EMA area).
Major: 23,400 (Would signal a deeper correction).
2. Chart Pattern & Wyckoff/Elliott Wave Context
Pattern: The price action from the September low exhibits characteristics of a Wyckoff Accumulation phase, followed by a strong markup. The current pause could be a re-accumulation before the next leg up, or a distribution.
Elliott Wave Count: The rally from the ~23,400 low is impulsive. We are likely in a Wave 4 (corrective) consolidation. A break above 24,200 would confirm the start of Wave 5 towards new highs. A break below 23,650 would invalidate this count.
3. Indicator Confluence & Momentum
Ichimoku Cloud (Daily): Price is well above the Senkou Span (Cloud), confirming the strong bullish trend. The cloud itself is thick and rising, providing strong dynamic support.
RSI (14): On the daily, RSI is neutral (~60), not yet overbought, leaving room for further upside.
Bollinger Bands (4H): Price is hugging the upper band, indicating strength. A move to the middle band (~23,950) would be a healthy pullback.
Moving Averages: The 50 EMA (23,850) and 200 EMA (23,500) are bullishly aligned, acting as dynamic support layers.
Actionable Trading Plan
Intraday Trading (Based on 1H/15M Charts)
Bullish Breakout Setup:
Trigger: Sustained price action above 24,150 with rising volume.
Buy Entry: On a pullback to 24,100-24,130, or a break of 24,200.
Stop Loss: Below 24,000.
Targets: 24,300 (TP1), 24,450 (TP2).
Bearish Rejection Setup:
Trigger: Bearish reversal candle (e.g., Shooting Star, Bearish Engulfing) at 24,150-24,200.
Sell Entry: On the confirmation of the rejection.
Stop Loss: Above 24,250.
Targets: 23,950 (TP1), 23,850 (TP2).
Swing Trading (Based on 4H/Daily Charts)
Long Swing Entry:
Condition: Wait for a daily close above 24,300.
Entry: On the next pullback towards 24,200 (new support).
Stop Loss: Below 23,900.
Target: 24,600 - 24,800.
Short Swing Entry (Counter-Trend):
Condition: A clear break and close below 23,900.
Entry: On a retest of 23,900 as resistance.
Stop Loss: Above 24,100.
Target: 23,750, then 23,650.
Risk & Trade Management Note
The current setup is a high-probability bull trap if price fails at the 24,200 resistance. Conversely, a breakout opens significant upside. Do not chase price in the middle of the range. Patience for a confirmed trigger is key. Always use a stop-loss and manage position size accordingly.
I am nothing @shunya.trade
Disclaimer
The information and publications are not meant to be, and do not constitute, financial, investment, trading, or other types of advice or recommendations supplied or endorsed by TradingView. Read more in the Terms of Use.
I am nothing @shunya.trade
Disclaimer
The information and publications are not meant to be, and do not constitute, financial, investment, trading, or other types of advice or recommendations supplied or endorsed by TradingView. Read more in the Terms of Use.