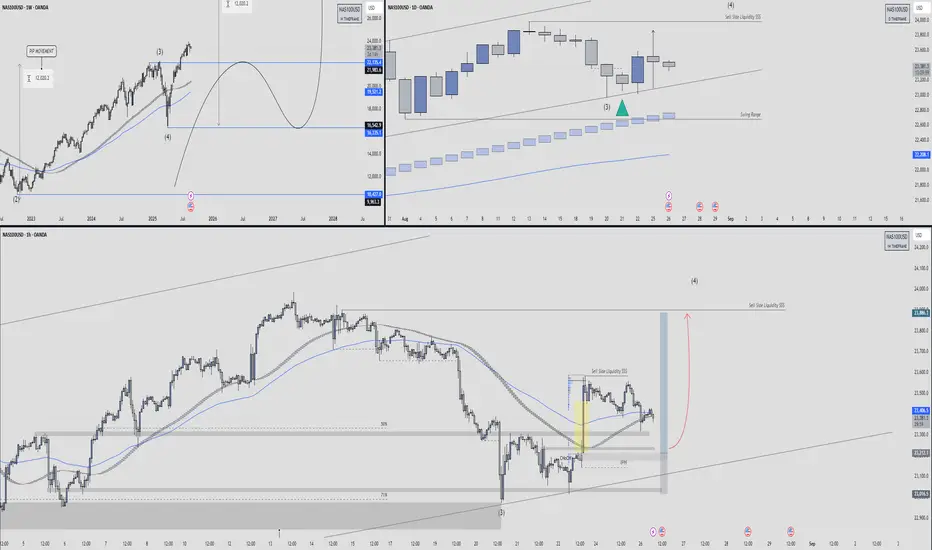
🕰 Weekly Structure
Price has completed a Wave (3) high and is now transitioning into a corrective Wave (4) phase.
The broader market cycle suggests sell-side liquidity is being targeted before any new impulsive leg higher.
The EMA structure is still bullish long-term, but retracements are healthy after extended rallies.
Key downside zones:
21,985 – 22,135 (mid-support pocket)
16,962 – 16,353 (deeper retracement if correction extends)
📉 Daily Timeframe
Current daily candles are rejecting the upper levels after tagging swing-high liquidity.
Price is consolidating near the swing range support line (~22,700–23,200).
Buyers are defending the level marked by the green triangle, aligning with a previous Wave (3) pivot.
If this level holds, we may see a relief rally targeting 23,800–24,200 before deciding the next move.
⏱ 1H Short-Term View
Price recently tapped into sell-side liquidity (SSS) and bounced from the 71% fib retracement + demand zone.
A change of character (ChoCH) is visible from the highlighted yellow candle, indicating buyers are stepping in.
Expect a possible bullish leg toward 23,800 – 24,000 if higher-low structure confirms.
If 23,200 fails, downside liquidity sits at 23,000 → 22,700.
🎯 Trade Plan
Bias: Short-term bullish relief rally inside larger corrective Wave (4).
Entry Zone: 23,200 – 23,400 demand retest.
Target 1: 23,800 (SS liquidity pocket)
Target 2: 24,000–24,200 (daily resistance)
Invalidation: Sustained close below 23,000 → opens path to 22,200.
📌 Summary
NAS100 looks corrective after a strong multi-month bullish wave. Near-term, liquidity sweep setups favor a bounce into 23,800+ as long as 23,000 holds. Medium-term, Wave (4) correction could extend deeper into 22k–20k levels before the next major bullish wave.
Disclaimer
The information and publications are not meant to be, and do not constitute, financial, investment, trading, or other types of advice or recommendations supplied or endorsed by TradingView. Read more in the Terms of Use.
Disclaimer
The information and publications are not meant to be, and do not constitute, financial, investment, trading, or other types of advice or recommendations supplied or endorsed by TradingView. Read more in the Terms of Use.