The  NASDAQ has shown a strong short-term recovery after breaking a major descending trendline. However, price is now testing a significant resistance zone, and a technical pullback is likely before the uptrend can continue.
📊 Technical Analysis: 30-minute Chart

📉 1. Overall Trend

🟥 2. Resistance Zone: 24,596 – 24,681

🟦 3. Support Zone: 24,383 – 24,500
🔁 Potential Trade Setups
✳️ Primary Scenario (preferred):
Enter long if support holds:
🎯 TP1: 24,650
🎯 TP2: 24,700+
🛑 SL: Below 24,350 (trendline invalidation)
🔻 Alternative Scenario (risk):
✅ Conclusion
📊 Technical Analysis: 30-minute Chart
📉 1. Overall Trend
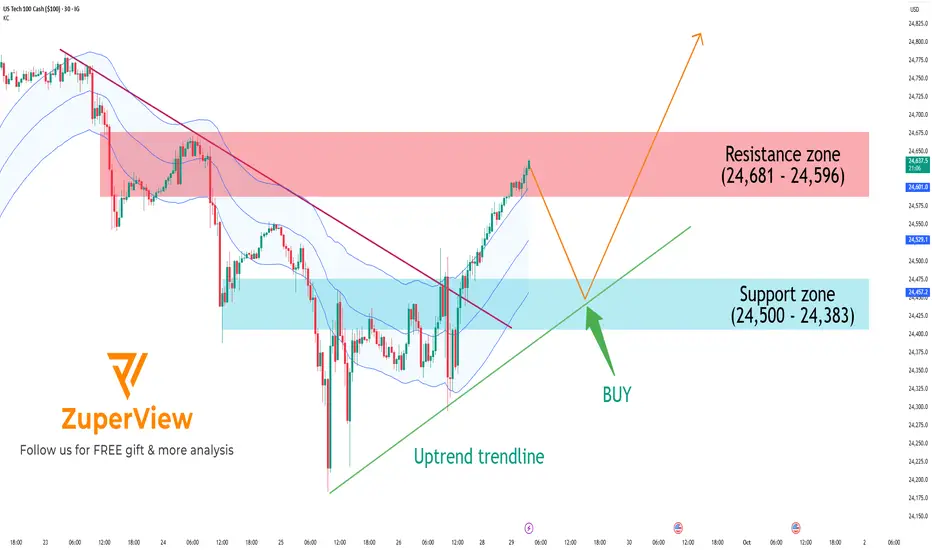
- Price has successfully broken above a descending trendline (red line), shifting market structure from bearish to bullish.
- An uptrend line (green) is now acting as dynamic support.
- Price is trading near the upper band of the Keltner Channel, indicating sustained bullish momentum.
🟥 2. Resistance Zone: 24,596 – 24,681
- This zone has acted as a strong supply area in the past, causing multiple rejections.
- Price is currently testing this area again → a rejection or short-term pullback is highly probable.
🟦 3. Support Zone: 24,383 – 24,500
- This zone overlaps with previous consolidation and aligns with the uptrend line.
- If a pullback occurs, this area could attract buyers and act as a launchpad for the next leg up.
🔁 Potential Trade Setups
✳️ Primary Scenario (preferred):
- Price rejects at resistance → pulls back to support → bounces and resumes the uptrend
- Wait for a pullback toward 24,500 – 24,383
- Look for bullish price action (e.g., bullish engulfing, hammer) for entry
Enter long if support holds:
🎯 TP1: 24,650
🎯 TP2: 24,700+
🛑 SL: Below 24,350 (trendline invalidation)
🔻 Alternative Scenario (risk):
- If price breaks below 24,383 and the uptrend line fails → short-term trend could shift sideways or bearish
- Avoid long entries without a confirmed recovery
- Re-evaluate trend structure if support fails
✅ Conclusion
- A short-term uptrend is in place
- However, price is now testing a major resistance zone, and a healthy pullback is likely
Please like and comment below to support our traders. Your reactions will motivate us to do more analysis in the future 🙏✨
Disclaimer
The information and publications are not meant to be, and do not constitute, financial, investment, trading, or other types of advice or recommendations supplied or endorsed by TradingView. Read more in the Terms of Use.
Disclaimer
The information and publications are not meant to be, and do not constitute, financial, investment, trading, or other types of advice or recommendations supplied or endorsed by TradingView. Read more in the Terms of Use.