*Due to the platform's features, the charts are arranged in sequence from left to right, from the first to the ninth chart.
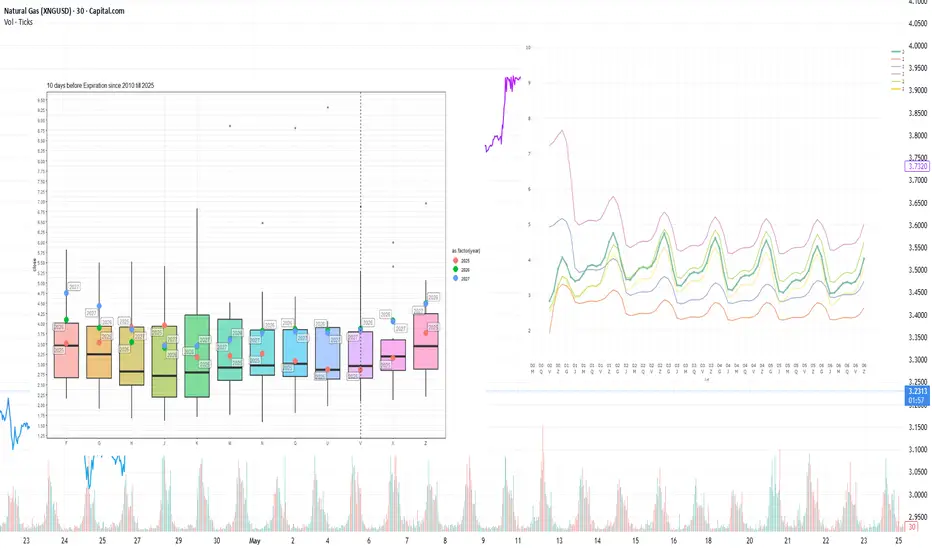
Current prices vs. price spread 10 days before expiration by month since 2010
[1-st Chart]
The expiration of the NGV25 contract is occurring near the 15-year median. The subsequent NGX25 contract is currently trading around the 10-day pre-expiration historical average, however, showing elevated volatility. Winter 2026 contract prices remain above the interquartile range.
Current forward curve vs. 2020-2024
[2-nd Chart]
The forward curve shape remains stable, increasingly resembling the configurations observed on comparable calendar dates in 2023 and 2024. This pattern is particularly evident in contracts with delivery three years from now or longer, where a pronounced convergence toward historical pricing levels is occurring.
Current inventory and forecast for next week compared to 2019-2024
[3-rd Chart]
During Week 38 (September 15–21), storage inventories are projected to increase by +76 BCF, reaching 3,509 BCF — already surpassing 2024 storage levels. Meanwhile, injection rates have slowed due to reduced cooling demand and now align with the five-year median pace. Elevated production remains the primary driver behind inventory growth.
Weekly HDD+CDD total from current NOAA data and forecast for the next two weeks comparing 1994-2024
[4-th Chart]
Across the continent, the current year’s Week 39 is marked by HDD+CDD values significantly below the 30-year historical average. Forecasts for Week 40 suggest continued weakness in these metrics, which is expected to suppress demand further and may reignite downward pressure on prices.
Explanation of the chart: candles represent quantiles for 30 years from 1994 to 2024. Red dots 2024, green 2025, blue prediction 2025.
Weekly HDD+CDD total from current NOAA data and forecast for the next two weeks compared to 1994-2024 by region
[5-th Chart]
Forecasts across key regions align with the broader trend: HDD+CDD values remain below the 30-year historical average.
Weekly cumulative supply/demand differentials compared to 2014-2024
[6-th Chart]
Despite elevated inventory levels and robust production pace, the weekly aggregate supply-demand spread chart for the 2014–2024 period illustrates a key observation: the divergence between demand and supply has widened significantly above the decade-long average and now mirrors the level seen during the same week in 2024. The main factors sustaining strong demand include consistently high LNG exports, steady industrial consumption, and gas-fired power generation.
Number of Days for Deliveries from Storages
[7-th Chart]
The chart illustrates the number of supply days equated to solely storage deliveries, assuming current consumption levels. In February–March 2025, inventories stood at 10–18 days — it’s comparable to or slightly below the historical average. From May through August, coverage increased to 25–35 days, which remains somewhat below the 10-year range. By September 2025, inventories rose to 33 delivery days, aligning with the median but still below the peaks observed in 2015–2016. This moderate level of storage adequacy creates a structurally tighter market, where even minor production disruptions or modest demand spikes can trigger disproportionate price reactions - especially during the late winter to early spring period.
Weather Anomalies (HDD+CDD) and Fundamental Factors
[8-th Chart]
Overall, fundamental factors and weather anomalies are within the expected range, with no systemic deviations, except for isolated declines in LNG exports and Mexican exports, which may temporarily support prices.
Anomalies in Power Generation Sources
[9-th Chart]
Core generation across most sources has evidently stabilized, with remaining key anomalies observed in coal, hydro, and solar output.
This analysis was conducted in cooperation with Anastasia Volkova, analyst of LSE.
Head of Analytics Center at the European broker Mind-Money.eu
🌐 mind-money.eu
Website
🌐 igorisaev.com/
🌐 mind-money.eu
Website
🌐 igorisaev.com/
Disclaimer
The information and publications are not meant to be, and do not constitute, financial, investment, trading, or other types of advice or recommendations supplied or endorsed by TradingView. Read more in the Terms of Use.