📊 Key daily levels to watch
Here are approximate levels based on recent data:
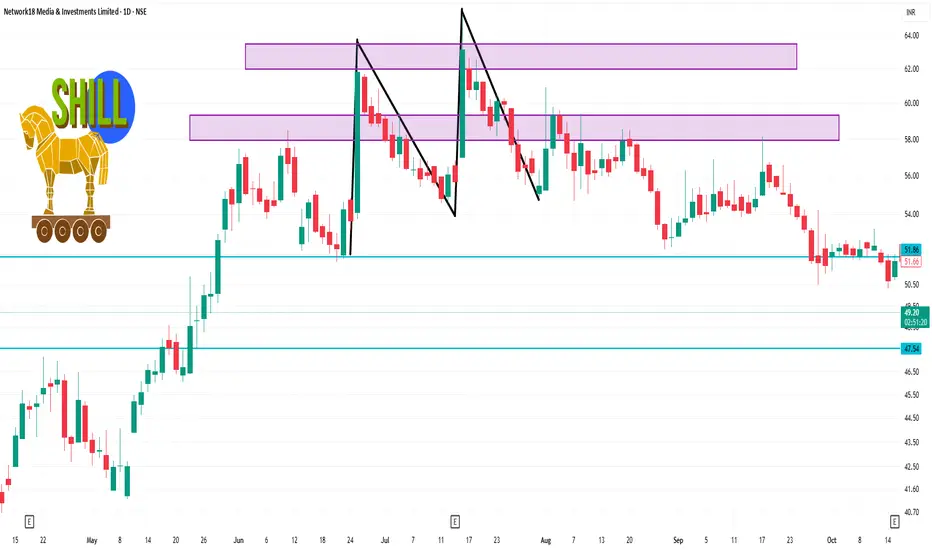
Support: around ₹47.50-₹48.00 region (the near lower band)
Resistance: around ₹50.00-₹52.00 region — a near barrier if the stock tries to bounce.
Pivot/central reference: ~ ₹48.15 (classic pivot) for the day.
📌 Interpretation for a Day Trader
a) If price remains above ~₹48.00 and holds, that level may act as a short-term base.
b) A decisive break above ~₹49.50-₹50.10 with good volume could open a short relief move towards the next resistance zone.
Conversely, a break below ~₹47.50 would signal risk of deeper downside and may invalidate the c) short-term support.
d) Because the trend/indicator setup is weak (daily technicals show “Strong Sell” for daily timeframe), any long trade should be cautious and risk-managed.
Here are approximate levels based on recent data:
Support: around ₹47.50-₹48.00 region (the near lower band)
Resistance: around ₹50.00-₹52.00 region — a near barrier if the stock tries to bounce.
Pivot/central reference: ~ ₹48.15 (classic pivot) for the day.
📌 Interpretation for a Day Trader
a) If price remains above ~₹48.00 and holds, that level may act as a short-term base.
b) A decisive break above ~₹49.50-₹50.10 with good volume could open a short relief move towards the next resistance zone.
Conversely, a break below ~₹47.50 would signal risk of deeper downside and may invalidate the c) short-term support.
d) Because the trend/indicator setup is weak (daily technicals show “Strong Sell” for daily timeframe), any long trade should be cautious and risk-managed.
Related publications
Disclaimer
The information and publications are not meant to be, and do not constitute, financial, investment, trading, or other types of advice or recommendations supplied or endorsed by TradingView. Read more in the Terms of Use.
Related publications
Disclaimer
The information and publications are not meant to be, and do not constitute, financial, investment, trading, or other types of advice or recommendations supplied or endorsed by TradingView. Read more in the Terms of Use.