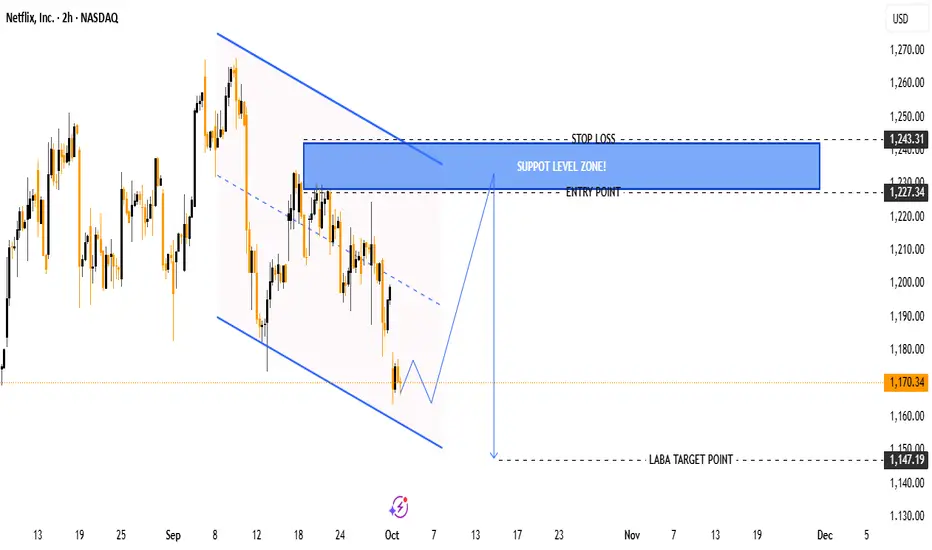
Ticker: Netflix (NFLX)
Timeframe: 2H (2-hour chart)
Current Price: $1,170.34
Chart Pattern: Descending channel (bearish trend continuation setup).
📉 Key Levels
Entry Point: $1,227.34
Marked as the level where price might retrace before resuming downward.
Stop Loss: $1,243.31
Positioned above the support/resistance flip zone to protect from false breakouts.
Target Point (LABA): $1,147.19
Expected downside target if the bearish move continues.
🧩 Technical Structure
The chart shows price moving within a descending channel.
The current price ($1,170.34) is near the lower boundary of the channel.
The analysis suggests a possible retracement (pullback) upward toward the support zone (blue area) before continuing the downtrend.
The blue box zone ($1,227 – $1,243) is a critical liquidity zone / resistance area, expected to reject price lower.
📊 Trading Plan (as per chart)
Sell/Short Setup:
Wait for retracement into the blue resistance zone ($1,227 – $1,243).
Enter short around $1,227.
Place Stop Loss above $1,243.
Take Profit near $1,147.
Risk/Reward:
Risk = ~ $16 (1,243 – 1,227).
Reward = ~ $80 (1,227 – 1,147).
Approx. R:R ratio = 1:5 (highly favorable).
✅ Summary:
This chart suggests Netflix (NFLX) is in a downtrend within a descending channel. A pullback to the $1,227–$1,243 zone could offer a shorting opportunity targeting $1,147, with a strong risk/reward ratio.
join my telegram channel t.me/goldmitalteam
t.me/goldmitalteam
t.me/goldmitalteam
Disclaimer
The information and publications are not meant to be, and do not constitute, financial, investment, trading, or other types of advice or recommendations supplied or endorsed by TradingView. Read more in the Terms of Use.