Today market showed some positive intent by reaching 24702 but could not sustain the levels and fell flat to close at 24487 giving up 215 points from the top. This proves that Nifty is continuously failing to sustain the momentum and after making a high seems to be plunging further and further. It seems to have become sell on bounce market. Every bounce is used by investors to exit theri positions. This is leads us into he current formation of lower highs and lower lows.
A change in pattern and formation is required for the market to go back to bullishness. The market seems to be waiting for some good news on Tariff front to spur the interest of retail investors. For this to happen a closing above the trend line is required. Right now market remains in a bear grip. Long term investors and dividend investors have an extended time to buy some stocks available at good value focus should be on the stocks that can maximize returns when the Bull rally begins. Buy in parts do not go all in at once as this market can present buying opportunities time and again.
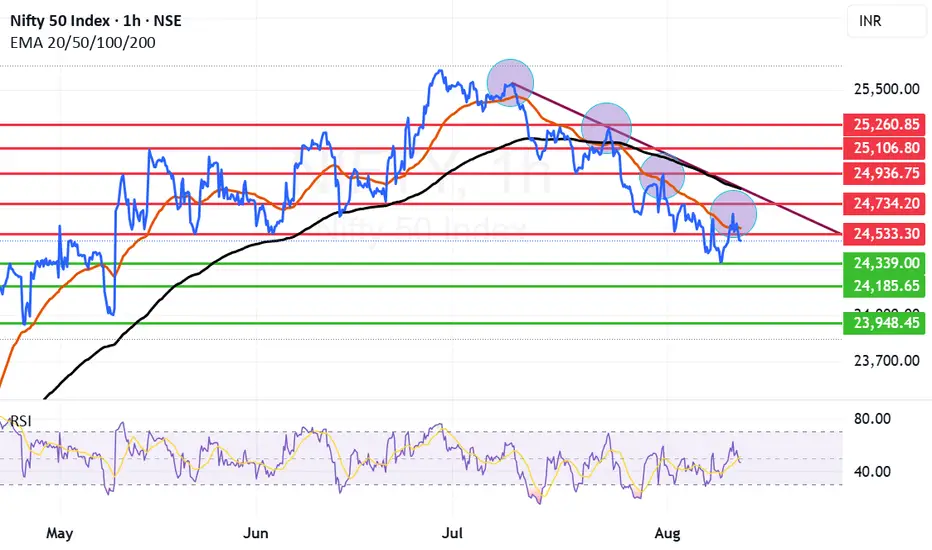
Supports for Nifty remain at: 24339, 24185 and 23948. (Market may fall into total Bear grip if we get a closing below 23948.)
Resistances for Nifty remain at: 24566 (Mother line resistance of an hourly chart), 24734, 24829 (Father line resistance). 24936, 25106 and finally 25260. (Bulls will control the market after we get a weekly closing above 25260).
Disclaimer: The above information is provided for educational purpose, analysis and paper trading only. Please don't treat this as a buy or sell recommendation for the stock or index. The Techno-Funda analysis is based on data that is more than 3 months old. Supports and Resistances are determined by historic past peaks and Valley in the chart. Many other indicators and patterns like EMA, RSI, MACD, Volumes, Fibonacci, parallel channel etc. use historic data which is 3 months or older cyclical points. There is no guarantee they will work in future as markets are highly volatile and swings in prices are also due to macro and micro factors based on actions taken by the company as well as region and global events. Equity investment is subject to risks. I or my clients or family members might have positions in the stocks that we mention in our educational posts. We will not be responsible for any Profit or loss that may occur due to any financial decision taken based on any data provided in this message. Do consult your investment advisor before taking any financial decisions. Stop losses should be an important part of any investment in equity.
A change in pattern and formation is required for the market to go back to bullishness. The market seems to be waiting for some good news on Tariff front to spur the interest of retail investors. For this to happen a closing above the trend line is required. Right now market remains in a bear grip. Long term investors and dividend investors have an extended time to buy some stocks available at good value focus should be on the stocks that can maximize returns when the Bull rally begins. Buy in parts do not go all in at once as this market can present buying opportunities time and again.
Supports for Nifty remain at: 24339, 24185 and 23948. (Market may fall into total Bear grip if we get a closing below 23948.)
Resistances for Nifty remain at: 24566 (Mother line resistance of an hourly chart), 24734, 24829 (Father line resistance). 24936, 25106 and finally 25260. (Bulls will control the market after we get a weekly closing above 25260).
Disclaimer: The above information is provided for educational purpose, analysis and paper trading only. Please don't treat this as a buy or sell recommendation for the stock or index. The Techno-Funda analysis is based on data that is more than 3 months old. Supports and Resistances are determined by historic past peaks and Valley in the chart. Many other indicators and patterns like EMA, RSI, MACD, Volumes, Fibonacci, parallel channel etc. use historic data which is 3 months or older cyclical points. There is no guarantee they will work in future as markets are highly volatile and swings in prices are also due to macro and micro factors based on actions taken by the company as well as region and global events. Equity investment is subject to risks. I or my clients or family members might have positions in the stocks that we mention in our educational posts. We will not be responsible for any Profit or loss that may occur due to any financial decision taken based on any data provided in this message. Do consult your investment advisor before taking any financial decisions. Stop losses should be an important part of any investment in equity.
Disclaimer
The information and publications are not meant to be, and do not constitute, financial, investment, trading, or other types of advice or recommendations supplied or endorsed by TradingView. Read more in the Terms of Use.
Disclaimer
The information and publications are not meant to be, and do not constitute, financial, investment, trading, or other types of advice or recommendations supplied or endorsed by TradingView. Read more in the Terms of Use.