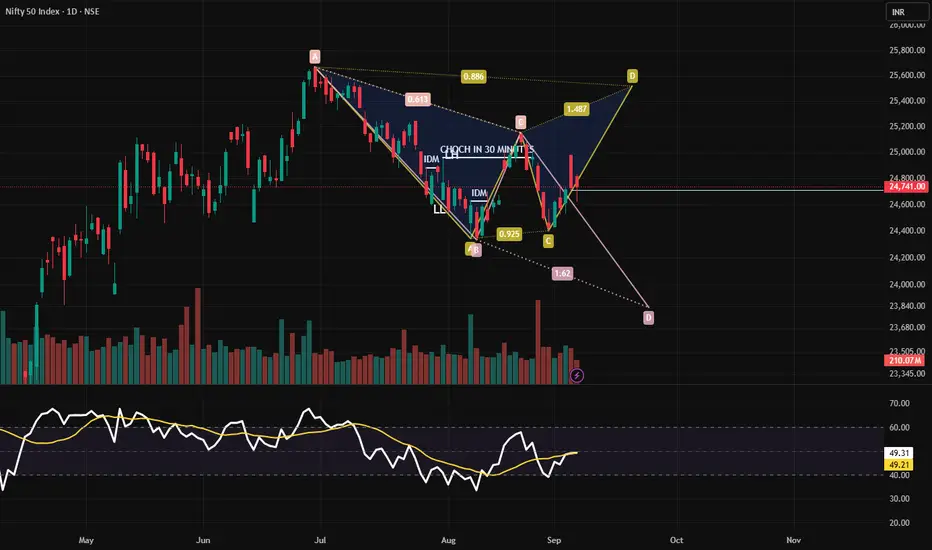
A harmonic structure (XABCD) is unfolding with both bullish recovery attempts and potential downside extension.
🔹 Pattern & Fibonacci Levels
XA: Fall from 25,800 → 24,150.
AB: Pullback to ~0.613 Fib retracement.
BC: Bounce to ~0.925 Fib (~24,500).
CD: Projection zones:
Upside target near 25,600 (1.487 extension).
Downside risk toward 23,800–23,500 (1.62 projection).
🔹 Key Zones
Resistance: 24,820 – 25,000, followed by 25,600.
Support: 24,400 initially, with deeper risk toward 23,800–23,500.
Current Price: 24,741 (+0.03%)
🔹 Momentum
RSI: At 49.21, hovering around neutral; shows indecision.
Volume: Spikes during recent swings suggest strong participation.
Moving averages: Trying to flatten out, signaling a possible reversal attempt.
📌 Trading View
Sustained close above 24,820–25,000 may trigger a rally toward 25,600.
Breakdown below 24,400 could accelerate fall to 23,800–23,500.
Neutral RSI suggests market awaiting a breakout direction.
#Nifty50 #TechnicalAnalysis #HarmonicPattern #TradingView #IndianMarkets
Disclaimer
The information and publications are not meant to be, and do not constitute, financial, investment, trading, or other types of advice or recommendations supplied or endorsed by TradingView. Read more in the Terms of Use.
Disclaimer
The information and publications are not meant to be, and do not constitute, financial, investment, trading, or other types of advice or recommendations supplied or endorsed by TradingView. Read more in the Terms of Use.