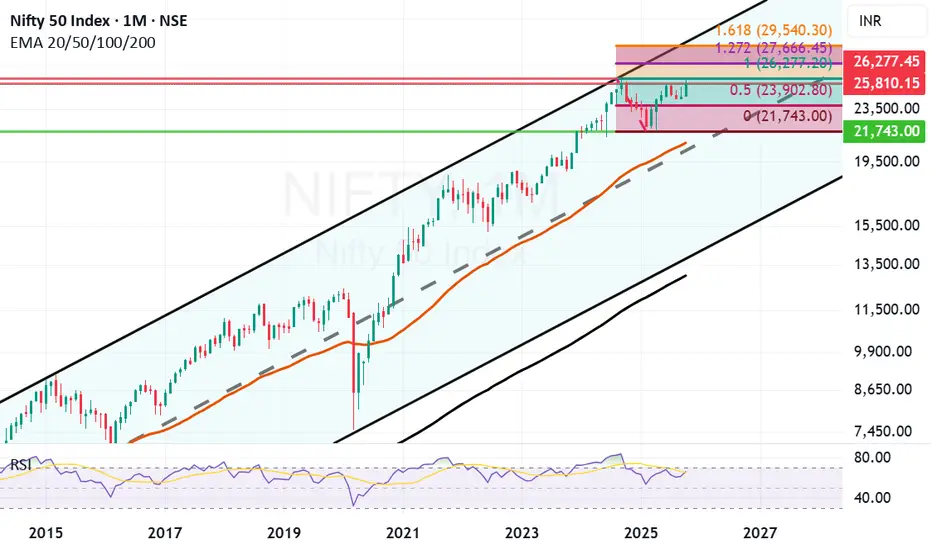
Despite negative closing for last 2 days of the month it was an overall good monthly candle for Nifty. Previous highest Monthly closing for Nifty was 25810 in September 2024. This month we got a closing slightly below the same at 25722 in October 2025. Once we get a closing above previous all time high in the next month or 2 on in few months time the doors for Next Fibonacci level opens. The next Fibonacci resistance level after we get a closing above previous ATH of 26277 will be at 27666. Golden Fibonacci ratio target in few years time will be 29540.
Very strong Fibonacci support now remains at 23902. Next Fibonacci level support in case of a catastrophic event will be at 21743. Mother line of 50 Months EMA remains at 20853 which is very close to mid-channel support in case there are multiple global or regional situations creating instability.
As of now the shadow of the candle seems positive however there is a chance of little bottom testing for Nifty before we get a new all time high. Sectoral rotations and reshuffling of portfolios of HNIs, MFs and FIIs might also be on card depending on the trade deals and newly emerging tariff scenarios.
Selective stocks which have been giving good results year on year and Quarter on Quarter from Consumption, Defense, Auto, Infrastructure, Banking and Capital Goods sectors including the PSUs themes look good for long term investment currently. While previous superstars of IT, Pharma, Services and other few sectors which lead the previous rally can tend to remain laggard and sideways, specially if the trade deal agreement remain unresolved. If the trade deals with EU and US, specially US goes through even these sectors will fight back and tend to perform.
Overall it was a good month of recovery where Nifty made a comeback from the lows of 24605 to reach 26104 gaining almost 1499 points at one point. Yet it was little disappointing to close below 26K at 25722. Still the positive is that we gained 1117 points this month which is not a bad show at all. Hoping that we get a monthly closing above 26K or previous ATH soon so that doors for next phase of Bull rally can commence swiftly.
Disclaimer: The above information is provided for educational purpose, analysis and paper trading only. Please don't treat this as a buy or sell recommendation for the stock or index. The Techno-Funda analysis is based on data that is more than 3 months old. Supports and Resistances are determined by historic past peaks and Valley in the chart. Many other indicators and patterns like EMA, RSI, MACD, Volumes, Fibonacci, parallel channel etc. use historic data which is 3 months or older cyclical points. There is no guarantee they will work in future as markets are highly volatile and swings in prices are also due to macro and micro factors based on actions taken by the company as well as region and global events. Equity investment is subject to risks. I or my clients or family members might have positions in the stocks that we mention in our educational posts. We will not be responsible for any Profit or loss that may occur due to any financial decision taken based on any data provided in this message. Do consult your investment advisor before taking any financial decisions. Stop losses should be an important part of any investment in equity.
Disclaimer
The information and publications are not meant to be, and do not constitute, financial, investment, trading, or other types of advice or recommendations supplied or endorsed by TradingView. Read more in the Terms of Use.
Disclaimer
The information and publications are not meant to be, and do not constitute, financial, investment, trading, or other types of advice or recommendations supplied or endorsed by TradingView. Read more in the Terms of Use.