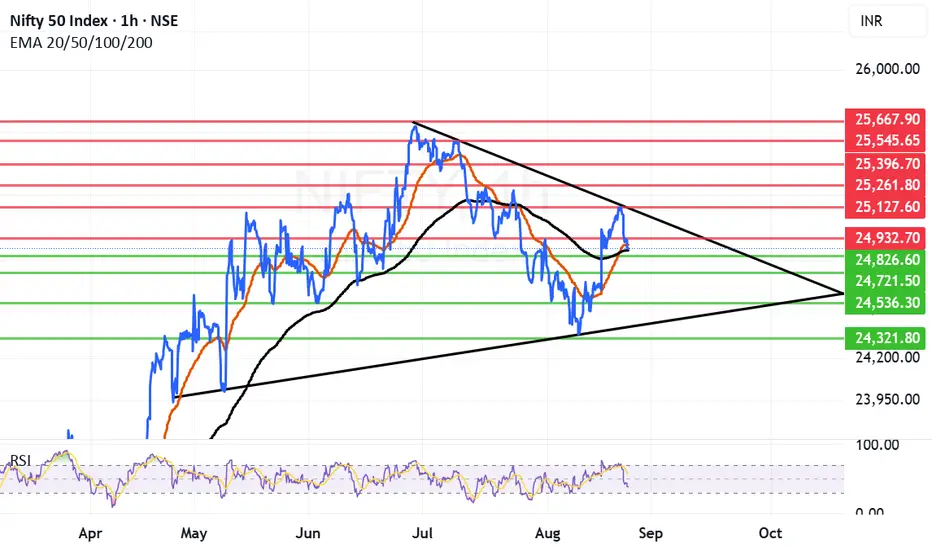
Trendline resistance has toppled Nifty which is now searching for support from where it can launch a recovery. For a recovery Nifty has to find a firm support which can act as a launchpad again for next phase of move.
If the support is not found in the relevant support zone it can again fall in bear grip. The support zone nearby starts from 24857 (Father line) and a zone nearby which is at 24826. If we get a closing below 24826 then Nifty can fall towards 24721, 24536 or even 24321 levels. 24321 seems to be a strong trendline support.
If Nifty takes support near 24857 or 24826 then (Today's low was 24859) the Nifty can go upwards. In this scenario the resistances for Nifty will be at 24892 (Mother line Resistance), 24932, 25127 (trendline resistance), 25261, 25396, 25545 and finally 25667. After closing above 25261 the Bulls will be back in business.
Disclaimer: The above information is provided for educational purpose, analysis and paper trading only. Please don't treat this as a buy or sell recommendation for the stock or index. The Techno-Funda analysis is based on data that is more than 3 months old. Supports and Resistances are determined by historic past peaks and Valley in the chart. Many other indicators and patterns like EMA, RSI, MACD, Volumes, Fibonacci, parallel channel etc. use historic data which is 3 months or older cyclical points. There is no guarantee they will work in future as markets are highly volatile and swings in prices are also due to macro and micro factors based on actions taken by the company as well as region and global events. Equity investment is subject to risks. I or my clients or family members might have positions in the stocks that we mention in our educational posts. We will not be responsible for any Profit or loss that may occur due to any financial decision taken based on any data provided in this message. Do consult your investment advisor before taking any financial decisions. Stop losses should be an important part of any investment in equity.
Disclaimer
The information and publications are not meant to be, and do not constitute, financial, investment, trading, or other types of advice or recommendations supplied or endorsed by TradingView. Read more in the Terms of Use.
Disclaimer
The information and publications are not meant to be, and do not constitute, financial, investment, trading, or other types of advice or recommendations supplied or endorsed by TradingView. Read more in the Terms of Use.