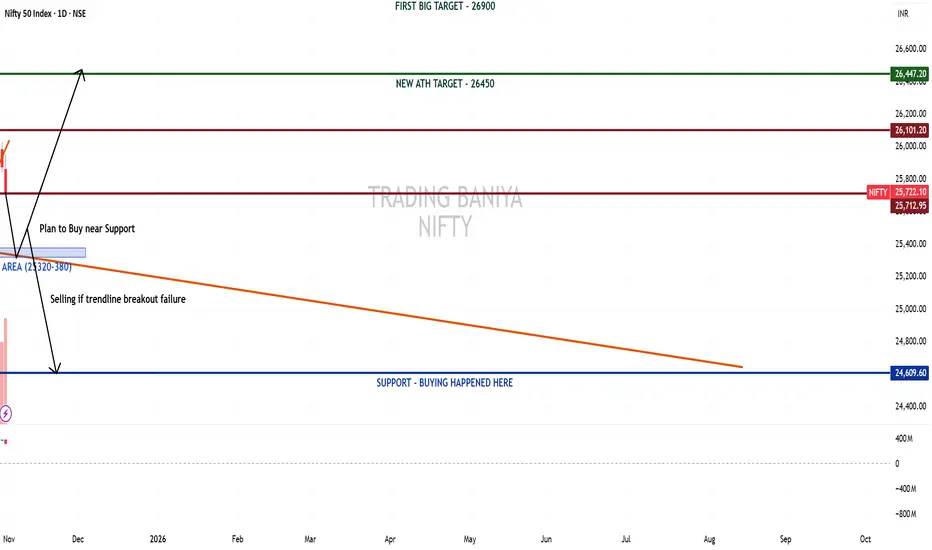
Nifty has shown strong bullish momentum on the monthly charts, maintaining its long-term uptrend structure. The larger trend continues to be positive, and once the ongoing consolidation completes, there's a high probability of the market heading towards a new all-time high around 26450.
On the weekly charts, Nifty appears to be taking a pause at the top, currently at a crucial decision zone. Price action here will decide the next major leg:
Sustained strength above 25800 will likely resume the uptrend toward ATH levels.
Failure to hold could trigger a short-term correction.
On the daily chart, an M pattern has formed at the top, accompanied by a trendline breakdown. This suggests a possible short-term pullback toward the support area between 25320 – 25380, which aligns with a previous breakout zone and near-term demand region.
This zone can act as a buying opportunity near support if price stabilizes and reverses.
However, if this area also breaks decisively, expect a sharper decline toward 24600 (major support where buying previously emerged).
Trade Plan:
📉 Short-term: Expect dip toward 25320–25380.
📈 Medium-term: Look for reversal signs near support to ride the next rally toward 26,100 and 26450 (ATH).
❌ Invalidation: Breakdown below 25,320 with volume and failure to reclaim trendline.
Disclaimer
The information and publications are not meant to be, and do not constitute, financial, investment, trading, or other types of advice or recommendations supplied or endorsed by TradingView. Read more in the Terms of Use.
Disclaimer
The information and publications are not meant to be, and do not constitute, financial, investment, trading, or other types of advice or recommendations supplied or endorsed by TradingView. Read more in the Terms of Use.