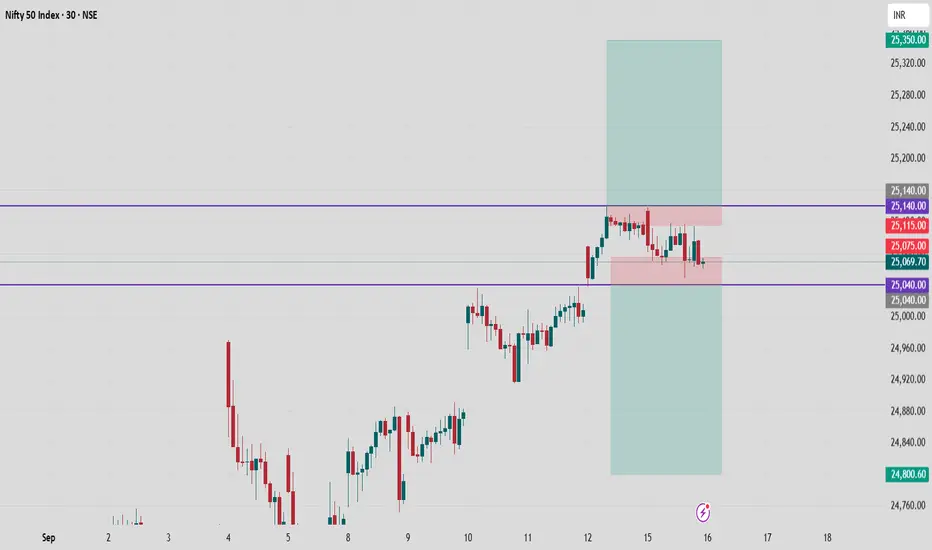
Nifty 50 Index is currently trading in a defined range, showing clear support and resistance on the 15-minute chart. Price action is consolidating between 25,040 and 25,140, indicating a sideways market phase perfect for range-based strategies.
Key Levels and Range
Resistance Zone: 25,140
Support Zone: 25,040
Current Price: 25,069.70
Observe rejection and congestion near these levels; strong movement is likely only on a breakout beyond this band.
Trading Setup
Bullish Scenario:
Go long on a breakout above 25,140.
Targets: 25,350.
Stop-Loss: Below 25,100.
Bearish Scenario:
Go short on a breakdown below 25,040.
Targets: 24,800.
Stop-Loss: Above 25,075.
Guidance
Aided by the highlighted red range, Nifty is accumulating energy for the next move.
Use strict risk management — trade only on valid breakout/breakdown candle closes for best results.
Stay alert for volume confirmation at breakout levels.
Trade with discipline — let price tell its story before reacting.
Follow for more such updates!
Technical Chart Analyst
Track: Indian & US Markets
Indices | Commodities | Crypto
Telegram: @ChartPathik for NSE & MCX
& @ChartPathik_Global for US Ins. & Crypto
WhatsApp: +91-99293-91467 for updates.
Track: Indian & US Markets
Indices | Commodities | Crypto
Telegram: @ChartPathik for NSE & MCX
& @ChartPathik_Global for US Ins. & Crypto
WhatsApp: +91-99293-91467 for updates.
Disclaimer
The information and publications are not meant to be, and do not constitute, financial, investment, trading, or other types of advice or recommendations supplied or endorsed by TradingView. Read more in the Terms of Use.