NIO Share Price Shows Signs of Strength
This week, the media highlighted that the share price of NIO Inc. (NIO), the Chinese smart electric vehicle manufacturer, fell after management announced a $1 billion share offering to raise capital. The funds are intended to finance projects such as the development of EV charging infrastructure.
Indeed, on 10 September, a wide bearish gap appeared on the chart, but by 11 September (yesterday) the bulls had almost entirely recovered the decline. This indicates bullish strength, possibly supported by a solid fundamental backdrop, driven by:
→ the expansion of NIO’s model range (which now includes the budget ONVO brand as well as the premium Firefly series);
→ higher delivery volumes – in the latest reporting quarter the company delivered 72,056 vehicles, up 25.6% compared to the previous period.
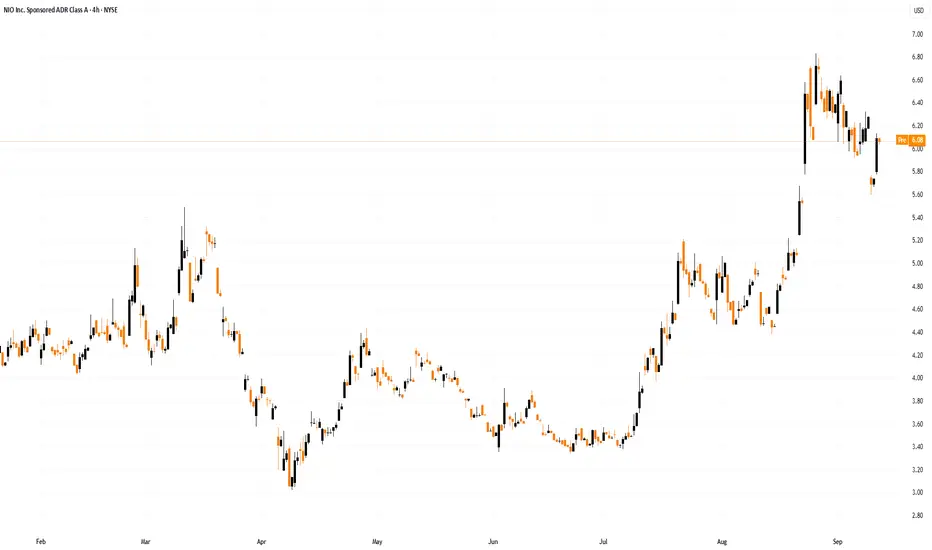
The NIO Inc. (NIO) price chart points to further bullish signals.

Technical Analysis of NIO Stock
Price movements are forming an ascending channel (shown in blue), with the following features:
→ The bulls managed to recover from the sharp decline 0→1, after which we observe the 1→6 sequence, typical of a bullish market, as each subsequent low and high is higher than the previous one.
→ Upward impulses are steep, while the subsequent pullbacks (which can be interpreted as a bullish flag pattern, shown in red) look like healthy corrections.
→ Key resistance levels are turning into support. This was the case with $4.40 and $5.30. The black arrow shows that the channel’s median line also acts as support – which led to the price moving above the psychological $6 level.
From a bearish perspective, resistance may be provided by the upper boundary of the current correction zone. However, the third bullish flag could be broken (as were the previous two), which would open the way for NIO’s share price to reach the upper boundary of the blue channel.
This article represents the opinion of the Companies operating under the FXOpen brand only. It is not to be construed as an offer, solicitation, or recommendation with respect to products and services provided by the Companies operating under the FXOpen brand, nor is it to be considered financial advice.
This week, the media highlighted that the share price of NIO Inc. (NIO), the Chinese smart electric vehicle manufacturer, fell after management announced a $1 billion share offering to raise capital. The funds are intended to finance projects such as the development of EV charging infrastructure.
Indeed, on 10 September, a wide bearish gap appeared on the chart, but by 11 September (yesterday) the bulls had almost entirely recovered the decline. This indicates bullish strength, possibly supported by a solid fundamental backdrop, driven by:
→ the expansion of NIO’s model range (which now includes the budget ONVO brand as well as the premium Firefly series);
→ higher delivery volumes – in the latest reporting quarter the company delivered 72,056 vehicles, up 25.6% compared to the previous period.
The NIO Inc. (NIO) price chart points to further bullish signals.
Technical Analysis of NIO Stock
Price movements are forming an ascending channel (shown in blue), with the following features:
→ The bulls managed to recover from the sharp decline 0→1, after which we observe the 1→6 sequence, typical of a bullish market, as each subsequent low and high is higher than the previous one.
→ Upward impulses are steep, while the subsequent pullbacks (which can be interpreted as a bullish flag pattern, shown in red) look like healthy corrections.
→ Key resistance levels are turning into support. This was the case with $4.40 and $5.30. The black arrow shows that the channel’s median line also acts as support – which led to the price moving above the psychological $6 level.
From a bearish perspective, resistance may be provided by the upper boundary of the current correction zone. However, the third bullish flag could be broken (as were the previous two), which would open the way for NIO’s share price to reach the upper boundary of the blue channel.
This article represents the opinion of the Companies operating under the FXOpen brand only. It is not to be construed as an offer, solicitation, or recommendation with respect to products and services provided by the Companies operating under the FXOpen brand, nor is it to be considered financial advice.
Disclaimer
The information and publications are not meant to be, and do not constitute, financial, investment, trading, or other types of advice or recommendations supplied or endorsed by TradingView. Read more in the Terms of Use.
Disclaimer
The information and publications are not meant to be, and do not constitute, financial, investment, trading, or other types of advice or recommendations supplied or endorsed by TradingView. Read more in the Terms of Use.