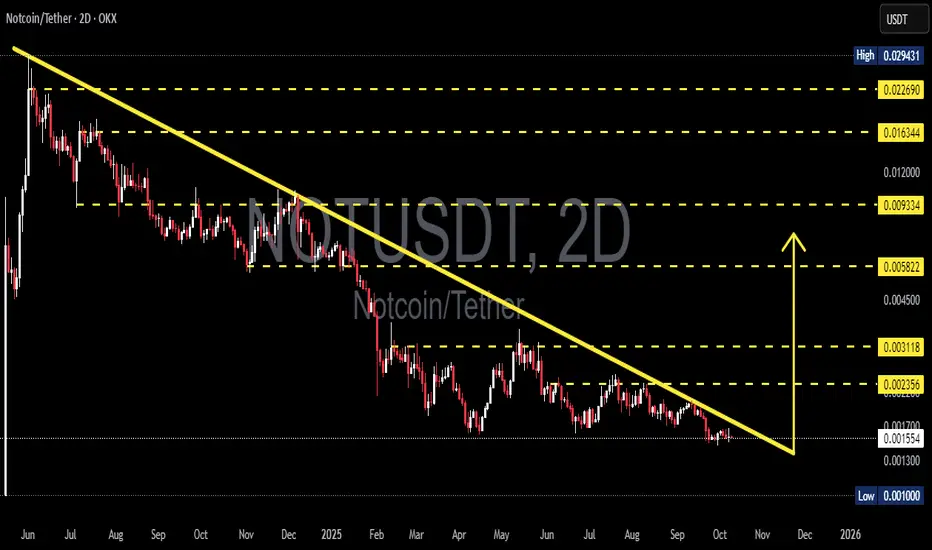
The 2D chart of NOT/USDT reveals a descending triangle formation — a classic compression pattern signaling that the market is reaching a major decision point. For months, price action has been trapped under a falling trendline (yellow), forming a series of lower highs, while buyers continue to defend the 0.0013–0.0010 support zone with persistence.
This setup now represents a make-or-break moment:
Will NOT finally break out of its long-term downtrend, or will it face one last capitulation before finding a true bottom?
---
🔹 Pattern Structure
Pattern: Descending Triangle — a compression setup often seen near the end of a prolonged downtrend.
Interpretation: Still technically bearish, but every failed breakdown strengthens the potential for a bullish reversal.
Volume: Gradually declining — showing quiet accumulation and energy buildup before a potential expansion.
---
🔹 Key Technical Levels
Support Zone: 0.0013 – 0.0010 (major buyer defense)
Current Price: ≈ 0.001558
Resistance Targets:
R1 → 0.002356 (initial breakout target)
R2 → 0.003118 (trend flip zone)
R3 → 0.005822 (momentum expansion)
R4 → 0.009334 – 0.016344 (mid-term resistance cluster)
---
🟢 Bullish Scenario
A confirmed 2D candle close above the yellow trendline with strong volume could trigger a reversal breakout, signaling the end of the prolonged compression phase.
In that case, the next impulsive targets lie near 0.002356 and 0.003118.
Typically, a clean breakout is followed by a retest — the best opportunity for confirmation-based entries.
📈 “Breakout + Retest = Momentum Reversal.”
---
🔴 Bearish Scenario
If the 0.0013–0.0010 support breaks down with expanding sell volume, the descending triangle confirms its bearish continuation role.
This could lead to a quick retest of the 0.0010 zone, potentially marking a final capitulation phase before long-term accumulation begins.
📉 “Losing the floor means retesting history.”
---
⚙️ Overall Perspective
The market is entering the final stage of compression — volatility and volume are tightening, signaling that a major directional move is approaching.
Whether up or down, this next move could define NOT/USDT’s mid-term trend into Q4 2025.
> “The longer the silence, the bigger the explosion that follows.”
---
#NOTUSDT #Notcoin #CryptoAnalysis #DescendingTriangle #BreakoutSetup #PriceCompression #TrendReversal #AltcoinAnalysis #CryptoTrading #TechnicalAnalysis #SupportResistance #MarketStructure
✅ Get Free Signals! Join Our Telegram Channel Here: t.me/TheCryptoNuclear
✅ Twitter: twitter.com/crypto_nuclear
✅ Join Bybit : partner.bybit.com/b/nuclearvip
✅ Benefits : Lifetime Trading Fee Discount -50%
✅ Twitter: twitter.com/crypto_nuclear
✅ Join Bybit : partner.bybit.com/b/nuclearvip
✅ Benefits : Lifetime Trading Fee Discount -50%
Disclaimer
The information and publications are not meant to be, and do not constitute, financial, investment, trading, or other types of advice or recommendations supplied or endorsed by TradingView. Read more in the Terms of Use.