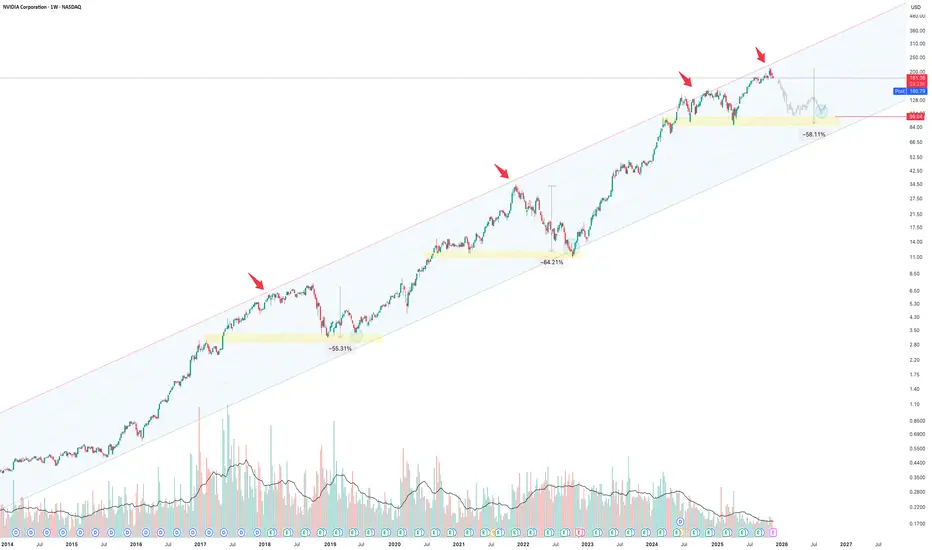
.NVIDIA has respected a long-term rising regression channel for nearly a decade, consistently forming major tops whenever price reaches the upper boundary (red arrows). Each touch of this upper trendline historically leads to a deep multi-month correction ranging between 55% and 64%, followed by a reversion toward the mid or lower channel bands.
The chart highlights three previous demand zones (yellow boxes) where NVIDIA ultimately bottomed during past bear cycles. These areas align closely with the mid/lower channel support, making them key structural zones for large-scale accumulation.
Price is currently extended again into the upper resistance region of the channel, a level where NVDA has never sustained long-term continuation without first undergoing a significant correction. A proportional decline of around 58%—consistent with prior cycles—would bring the stock back into the highlighted support region, maintaining long-term channel integrity.
Overall, this chart suggests NVIDIA is entering another high-risk stage of its cycle, where historical behavior favors a broad consolidation or deeper corrective move before the next major leg higher. The long-term uptrend remains intact, but the weekly chart implies elevated probability of mean reversion toward lower channel support.

Monthly Gaussian Channel
The chart highlights three previous demand zones (yellow boxes) where NVIDIA ultimately bottomed during past bear cycles. These areas align closely with the mid/lower channel support, making them key structural zones for large-scale accumulation.
Price is currently extended again into the upper resistance region of the channel, a level where NVDA has never sustained long-term continuation without first undergoing a significant correction. A proportional decline of around 58%—consistent with prior cycles—would bring the stock back into the highlighted support region, maintaining long-term channel integrity.
Overall, this chart suggests NVIDIA is entering another high-risk stage of its cycle, where historical behavior favors a broad consolidation or deeper corrective move before the next major leg higher. The long-term uptrend remains intact, but the weekly chart implies elevated probability of mean reversion toward lower channel support.
Monthly Gaussian Channel
Note
" This analysis is for informational and educational purposes only and should not be interpreted as financial advice, investment recommendations, or a solicitation to buy or sell any securities. Markets involve risk, and all trading or investing decisions should be made based on your own research, judgment, and risk tolerance. "
Disclaimer
The information and publications are not meant to be, and do not constitute, financial, investment, trading, or other types of advice or recommendations supplied or endorsed by TradingView. Read more in the Terms of Use.
Disclaimer
The information and publications are not meant to be, and do not constitute, financial, investment, trading, or other types of advice or recommendations supplied or endorsed by TradingView. Read more in the Terms of Use.