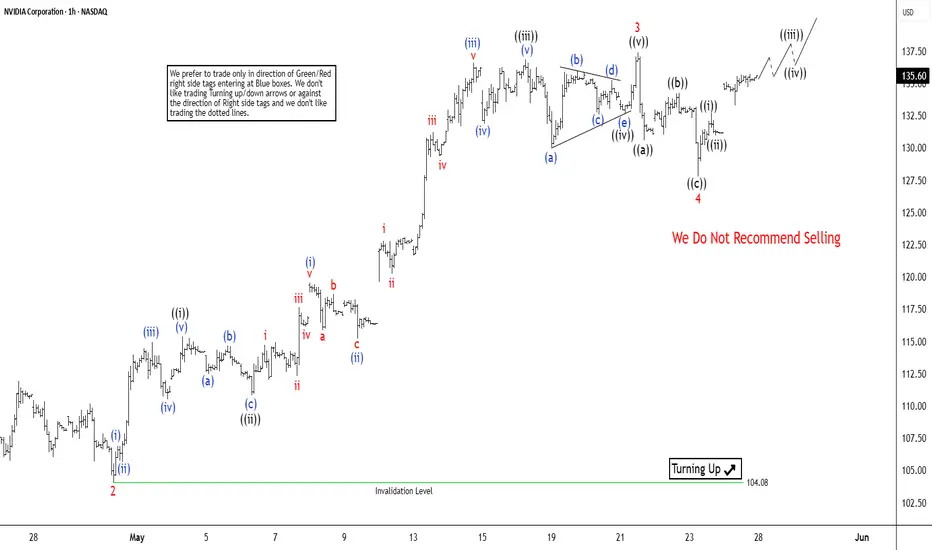
The short-term Elliott Wave analysis for NVIDIA (NVDA) indicates a bullish trend unfolding as an impulse structure since the low on April 21, 2025. From that low, the stock completed wave 1 at $111.92. The stock then followed by a corrective pullback in wave 2, which bottomed at $104.08. The subsequent rally in wave 3 displayed strong momentum, characterized by a nested impulse structure in a lesser degree. Within wave 3, the first sub-wave, wave ((i)), peaked at $115.40, with a brief dip in wave ((ii)) to $110.82. The powerful wave ((iii)) surged to $136.89, followed by a shallow pullback in wave ((iv)) to $132.65. The final leg, wave ((v)), concluded at $137.40, completing wave 3 on a higher degree.
The corrective wave 4 unfolded as a zigzag pattern. From the wave 3 peak, wave ((a)) declined to $130.59, wave ((b)) rebounded to $134.23, and wave ((c)) completed the pullback at $127.80, finalizing wave 4. NVIDIA has since resumed its upward trajectory in wave 5. As long as the pivot low at $104.08 holds, the stock is expected to extend higher in wave 5, completing the cycle from the April 21 low. Following this, a larger-degree three-wave pullback is anticipated, offering a potential pause in the bullish trend.
The corrective wave 4 unfolded as a zigzag pattern. From the wave 3 peak, wave ((a)) declined to $130.59, wave ((b)) rebounded to $134.23, and wave ((c)) completed the pullback at $127.80, finalizing wave 4. NVIDIA has since resumed its upward trajectory in wave 5. As long as the pivot low at $104.08 holds, the stock is expected to extend higher in wave 5, completing the cycle from the April 21 low. Following this, a larger-degree three-wave pullback is anticipated, offering a potential pause in the bullish trend.
14 days trial --> elliottwave-forecast.com/plan-trial/ and get Accurate & timely Elliott Wave Forecasts of 78 instruments. Webinars, Chat Room, Stocks/Forex/Indices Signals & more.
Disclaimer
The information and publications are not meant to be, and do not constitute, financial, investment, trading, or other types of advice or recommendations supplied or endorsed by TradingView. Read more in the Terms of Use.