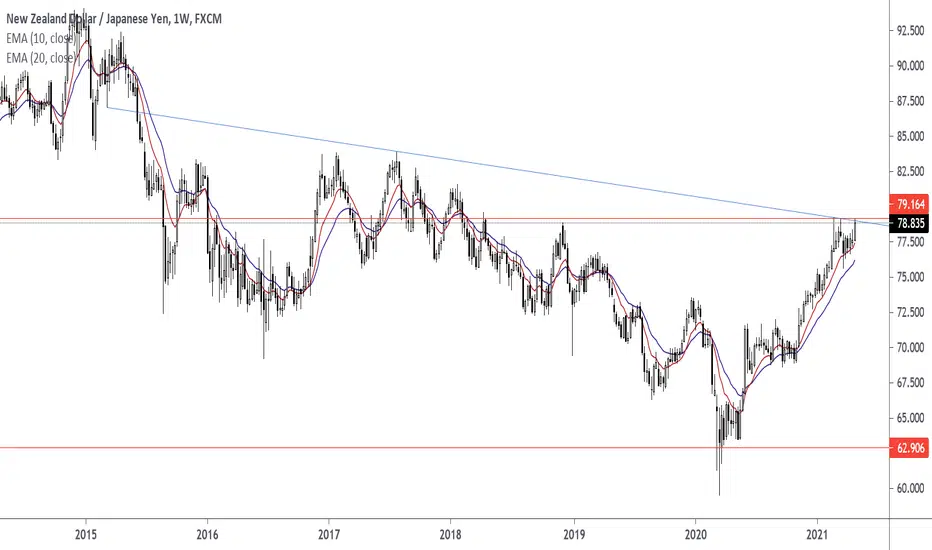
Higher Lows are pushing into trend line resistance. Watch for a breakout at 79.164 and enter using a price action signal.
EMA 10 EMA 20 are pointing up on the Weekly Chart, Daily Chart, and H4 Chart.


EMA 10 EMA 20 are pointing up on the Weekly Chart, Daily Chart, and H4 Chart.
Disclaimer
The information and publications are not meant to be, and do not constitute, financial, investment, trading, or other types of advice or recommendations supplied or endorsed by TradingView. Read more in the Terms of Use.
Disclaimer
The information and publications are not meant to be, and do not constitute, financial, investment, trading, or other types of advice or recommendations supplied or endorsed by TradingView. Read more in the Terms of Use.